What a record-hot season taught us in Graubünden

Field trials in Graubünden in 2026 show how VitiProtect —a joint collaboration between Weinbauzentrum Wädenswil (WBZW), Agroscope and databaum—can support more targeted downy-mildew management using local weather data and AI-based disease-risk modelling.
The 2026 Graubünden trials tested VitiProtect validation model 3.0 under commercial vineyard conditions, comparing the AI-supported programme with standard farm practice and untreated control plots.
The results are encouraging: substantially fewer treatments, longer intervals between sprays, and precisely timed interventions leading to low disease levels in the AI-managed plots—even during the warmest April–August period recorded in the four-year dataset.
Graubünden: a distinctive environment for viticulture
Graubünden is Switzerland's only trilingual canton, with German, Romansh and Italian forming part of its cultural identity. gr.ch
For winegrowing, the Bündner Herrschaft is particularly important. Fläsch, Maienfeld, Jenins and Malans form a wine region of around 350 hectares, where a mild climate, warm föhn winds and calcareous soils create favourable conditions for viticulture. Pinot Noir is especially prominent. Graubünden Ferien
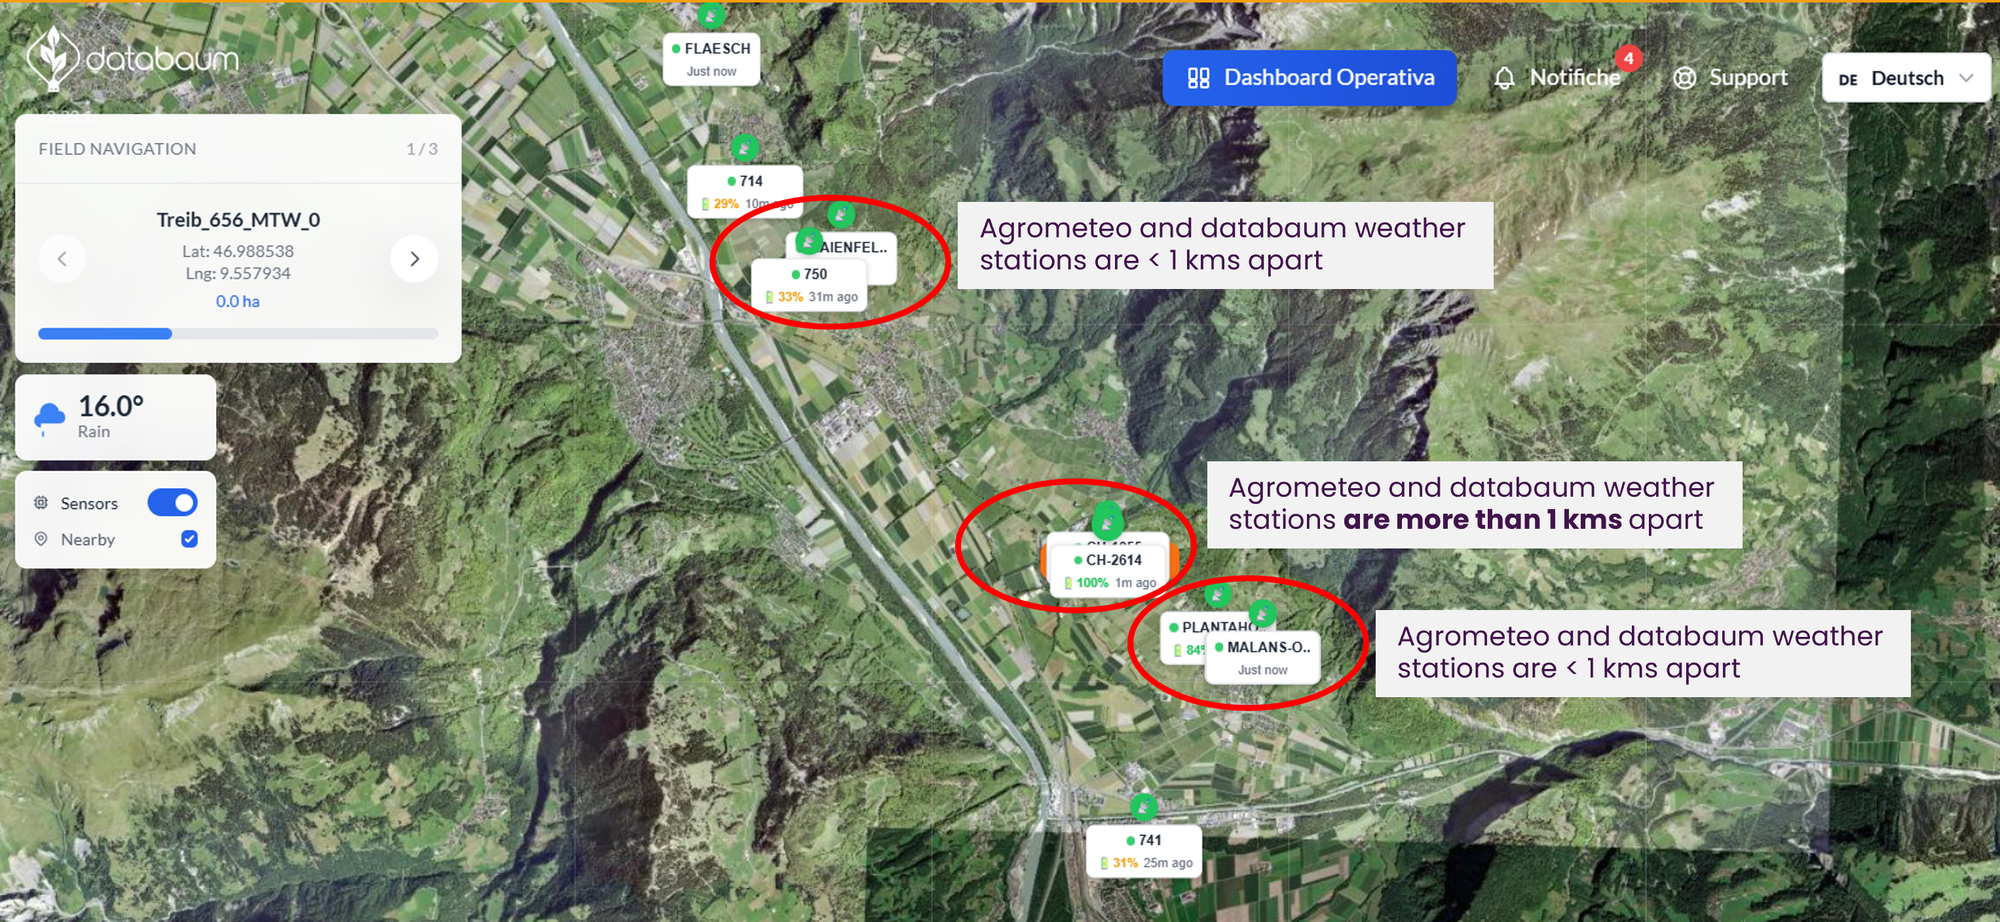
The VitiProtect field validation in Graubünden included three sites around Malans, Plantahof and Maienfeld. Two databaum weather stations were located less than one kilometre from corresponding Agrometeo stations, enabling direct comparison between local databaum measurements and the official agricultural weather network.
How the 2026 field trials worked ?
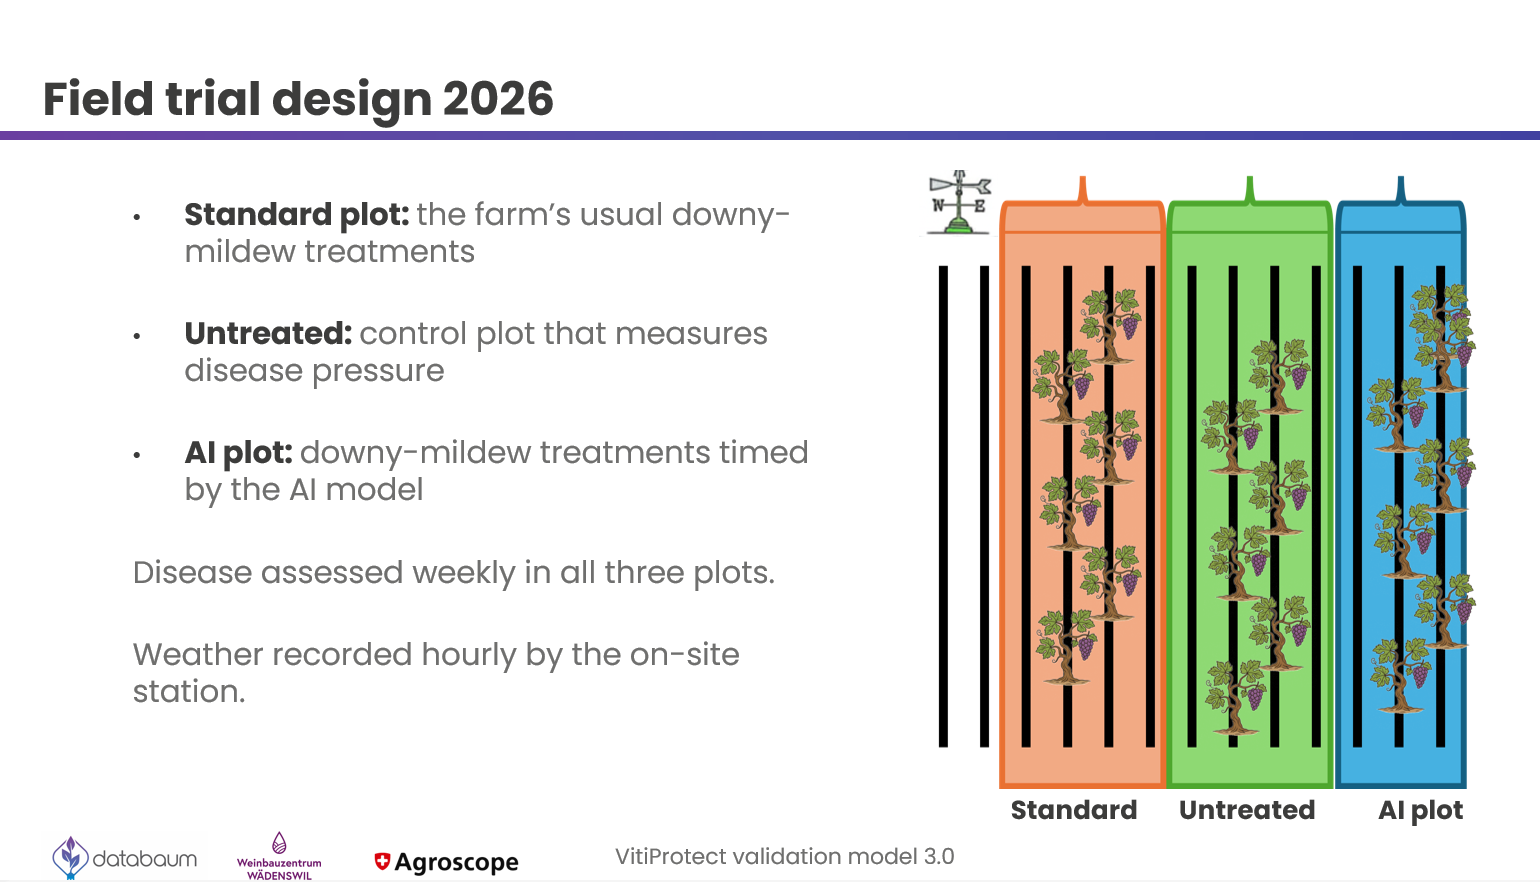
The trial design was deliberately practical. Each site compared the farm's usual downy-mildew management with an untreated control and a VitiProtect 3.0-guided plot.
In the standard plot, growers followed their usual downy-mildew treatment programme. The untreated plot provided a measure of actual disease pressure. In the AI plot, treatment timing was determined by the VitiProtect model. Disease was assessed weekly, while the on-site databaum weather stations recorded conditions hourly.
This makes the validation particularly relevant for growers: the objective was not simply to test an algorithm, but to evaluate whether model-supported recommendations could translate into workable vineyard decisions.
2026 was the warmest season in the monitored series
One of the clearest features of the season was temperature.
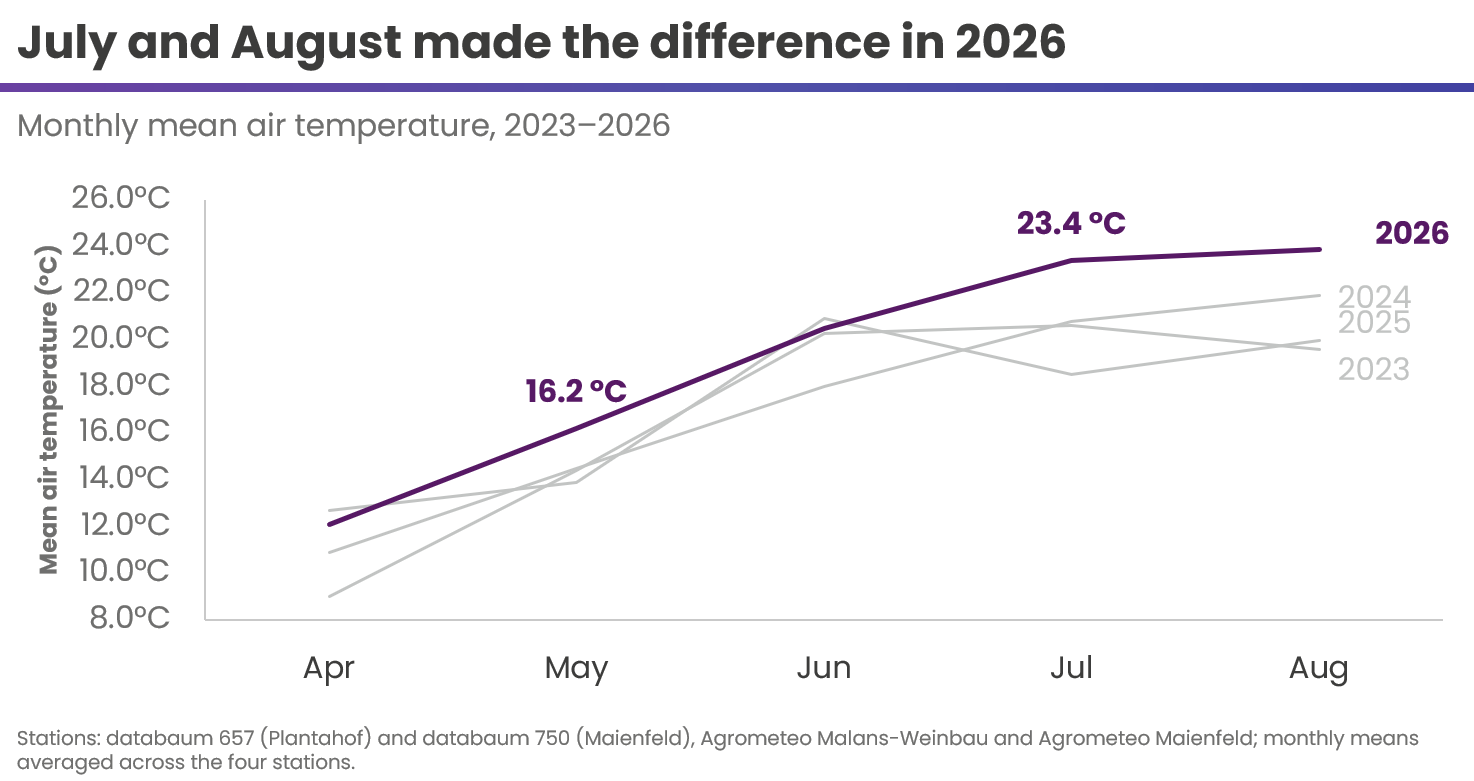
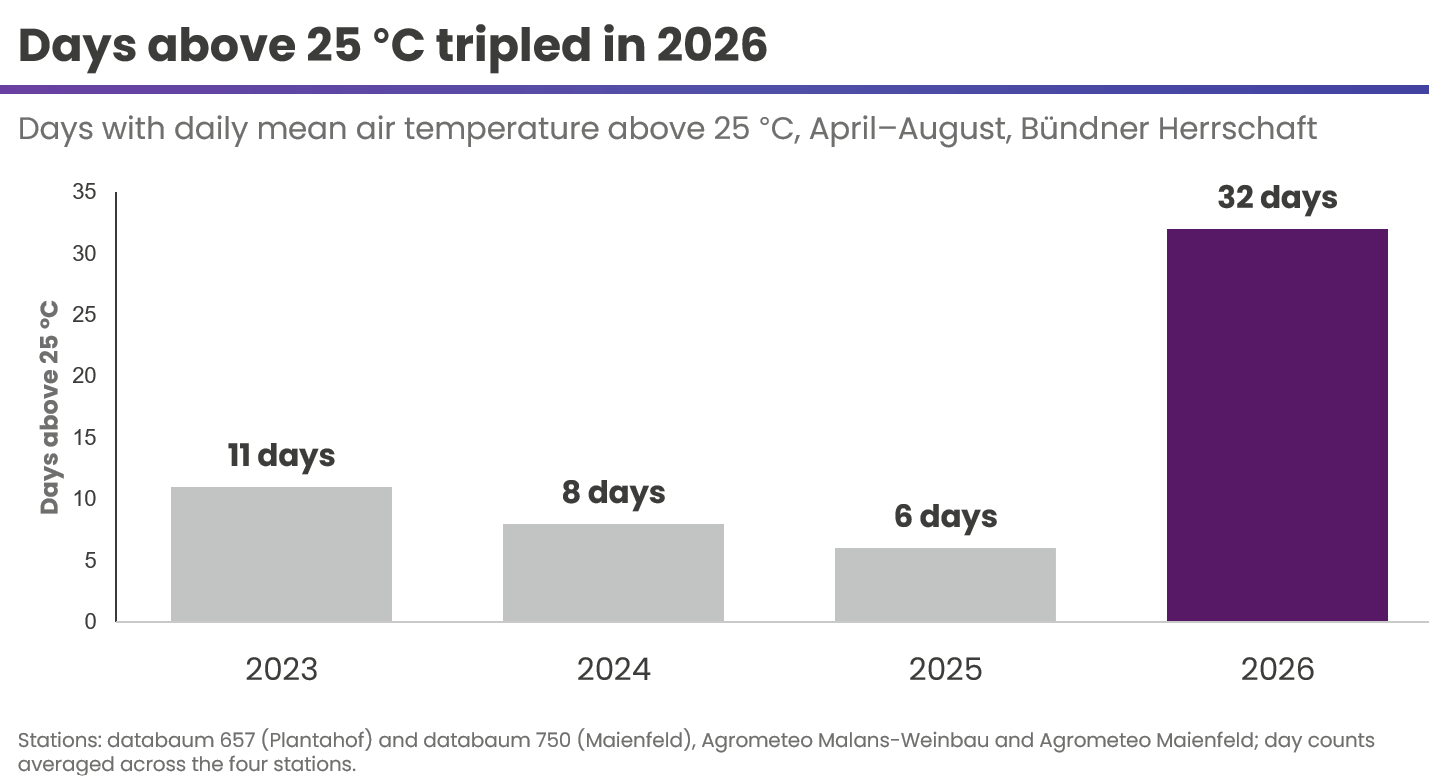
From April through August 2026, mean air temperature across the monitored stations reached 19.2°C, approximately 2.0°C above 2025. There were 32 days with a daily mean temperature above 25°C, compared with only 6 to 11 such days in the preceding three seasons.
July and August were particularly important in separating 2026 from earlier years.
For disease-management systems, such seasonal variation matters. A useful decision-support tool needs to respond to what is happening in the vineyard during a particular season rather than relying on a fixed treatment calendar.
Local databaum stations closely matched Agrometeo
For a field-level decision model, reliable weather input is fundamental.
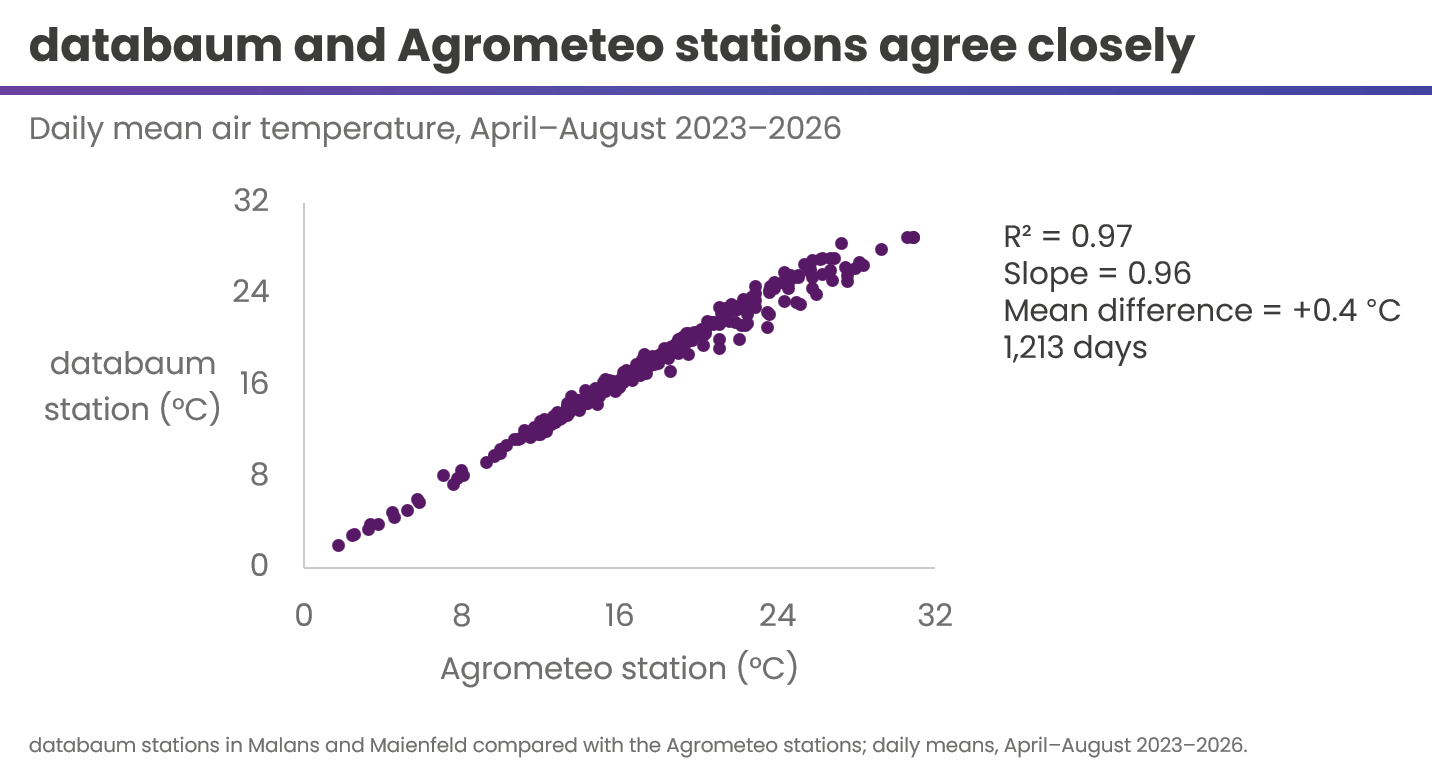
Across 1,213 paired daily observations from April to August 2023–2026, databaum and Agrometeo temperature measurements showed very close agreement:
R² = 0.97, a regression slope of 0.96, and a mean difference of only +0.4°C.
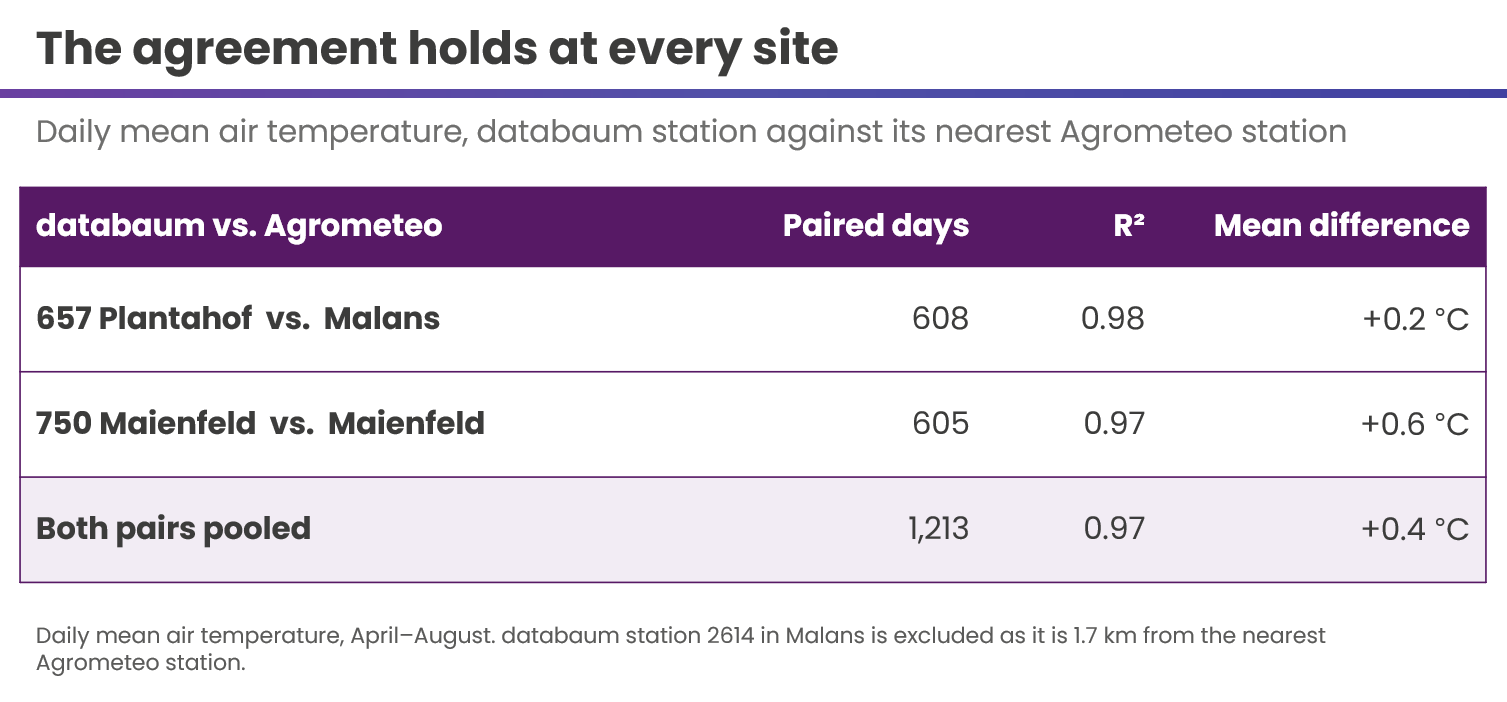
The relationship was also consistent at the individual locations. Plantahof versus Agrometeo Malans produced an R² of 0.98 with a +0.2°C mean difference, while the Maienfeld pair produced an R² of 0.97 with a +0.6°C mean difference.
This validation is important for VitiProtect because it demonstrates that the on-site stations provide measurements closely aligned with the established Agrometeo network while placing the sensors directly where vineyard-management decisions are being made.
Disease pressure was unusually low in 2026
Temperature alone does not determine disease pressure.
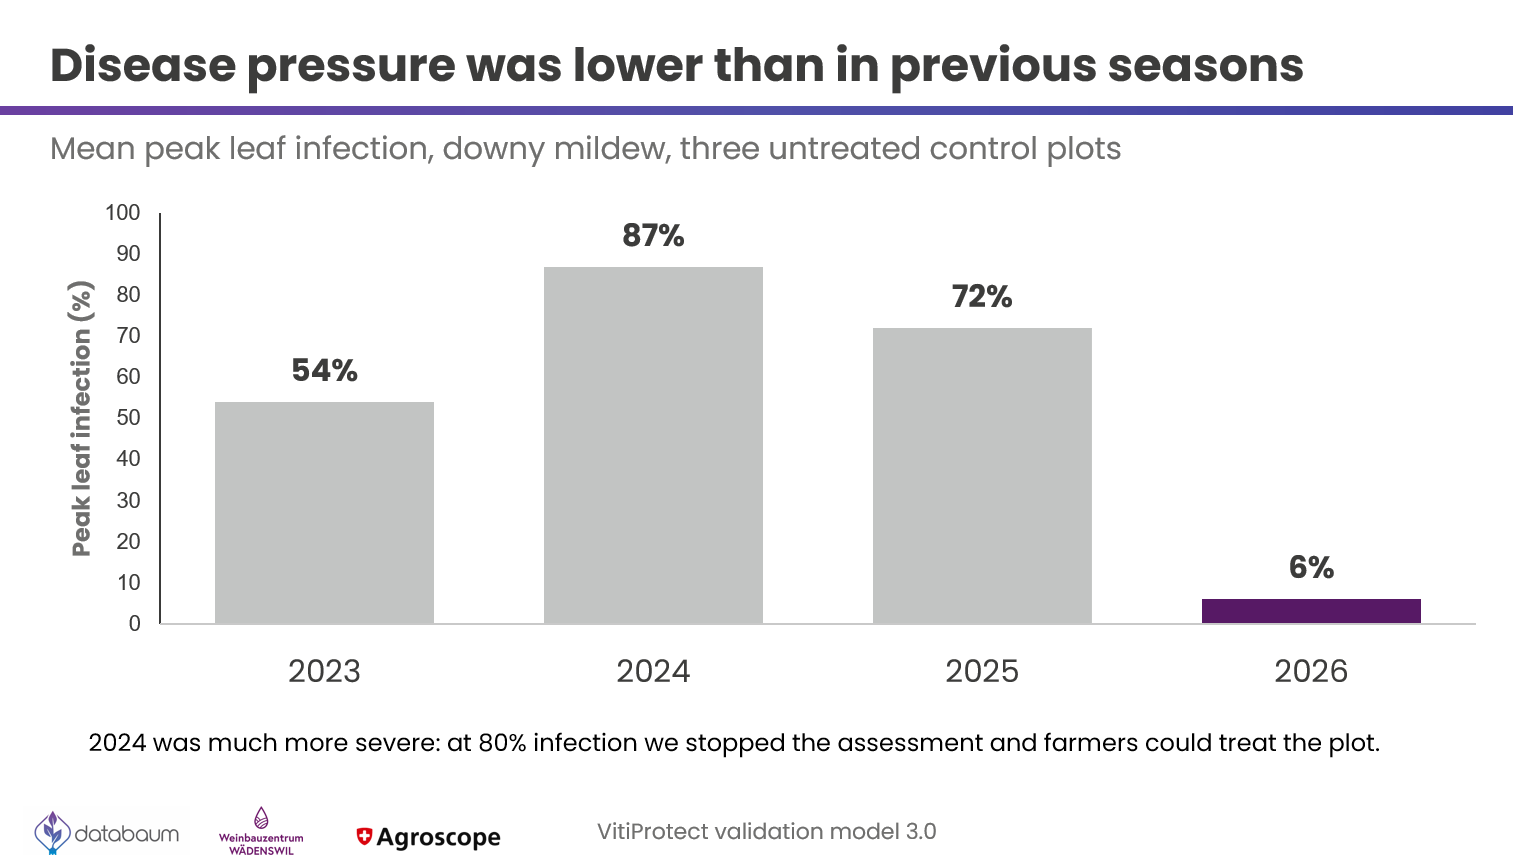
Despite the very warm season, downy-mildew pressure in the untreated plots was considerably lower than in the previous three years. Mean peak leaf infection across the three untreated plots reached 6% in 2026, compared with 54% in 2023, 87% in 2024 and 72% in 2025.
That context is essential when interpreting the treatment reductions.
The 2026 trial does not demonstrate how VitiProtect would perform under the very high disease pressure observed in 2024. Instead, it demonstrates another important capability for decision support: recognizing a relatively low-pressure season and avoiding unnecessary applications while keeping disease under control.
VitiProtect AI disease model approximately halved treatments
The clearest operational result was the reduction in downy-mildew treatments.
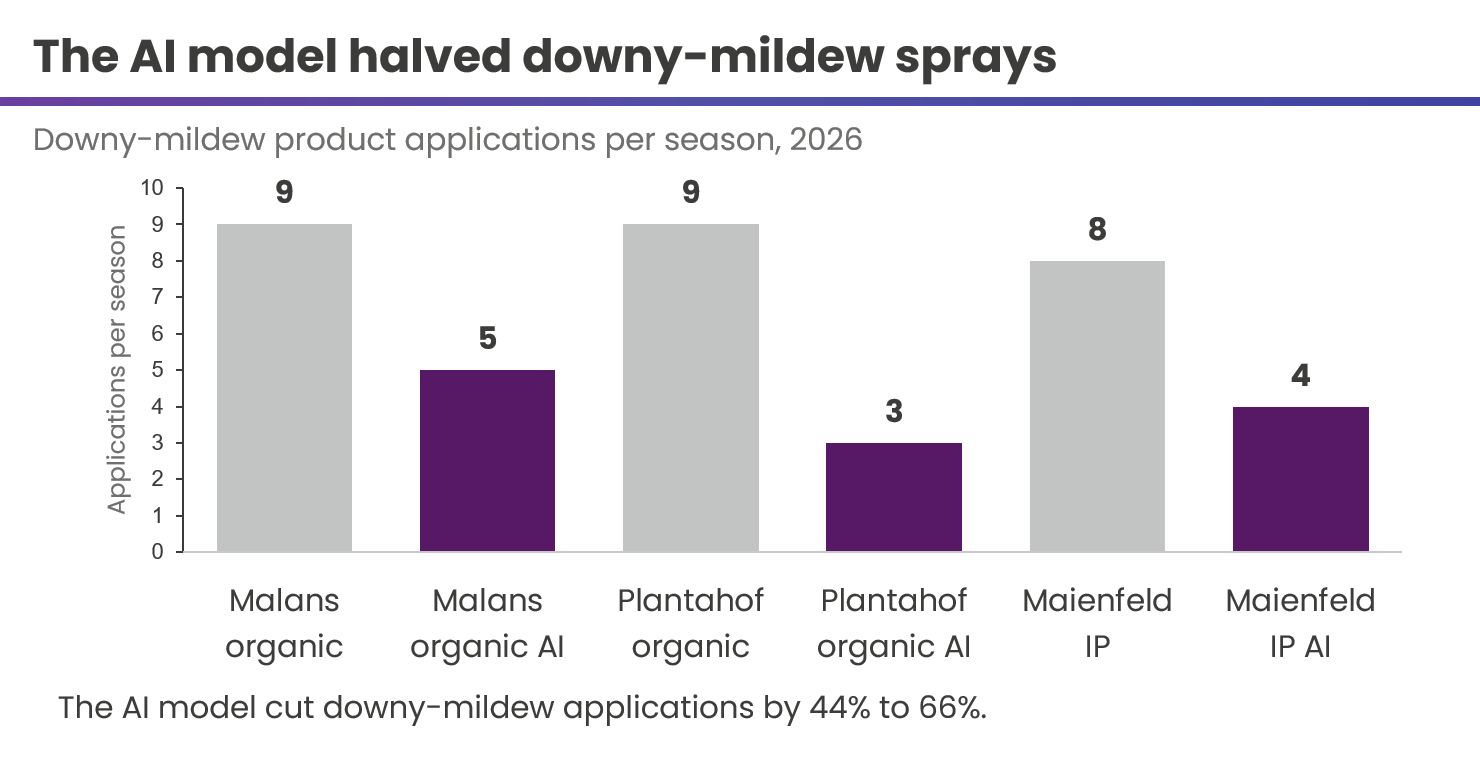
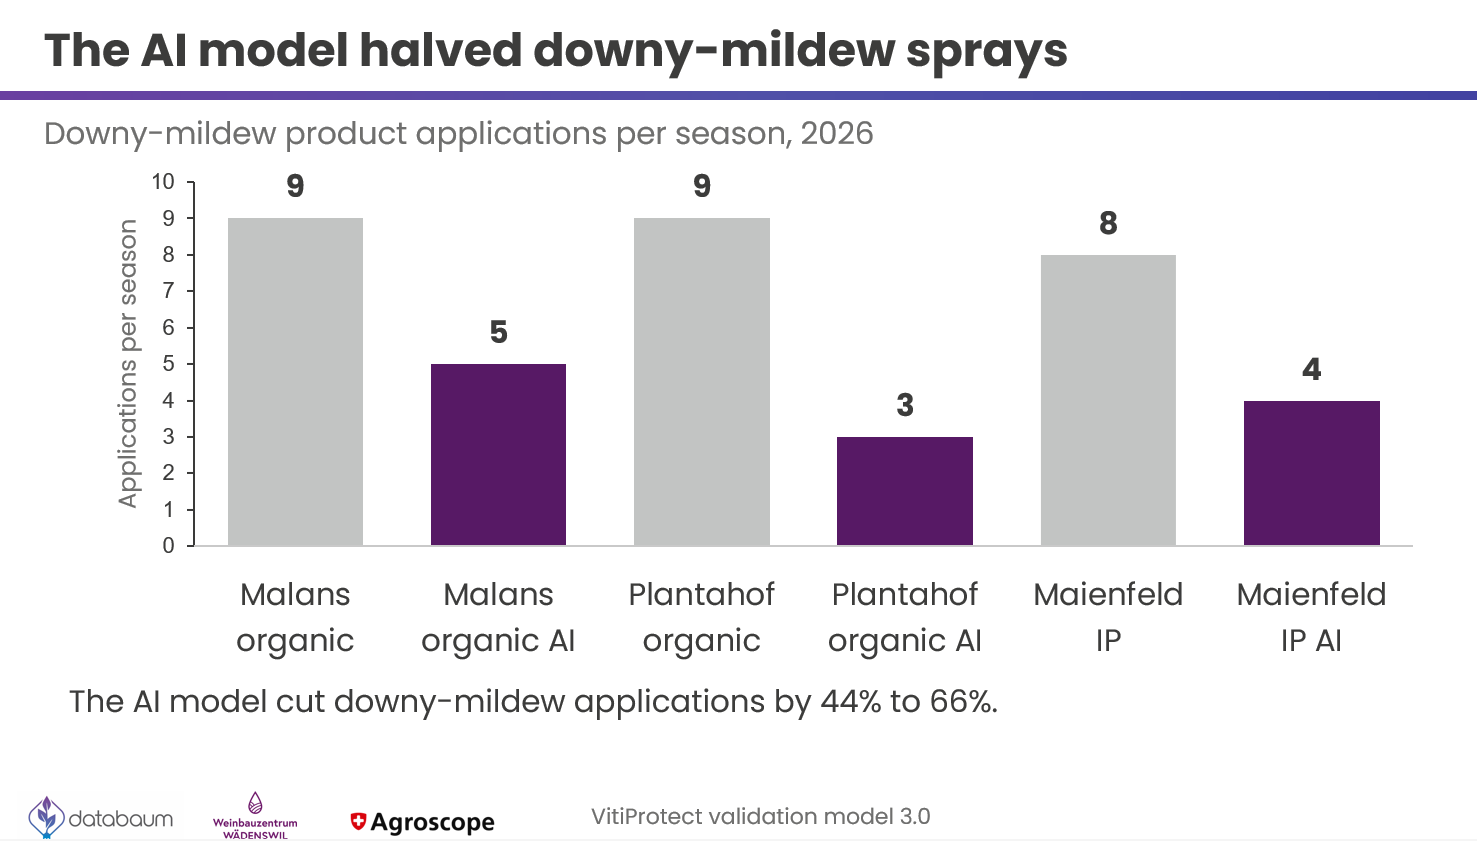
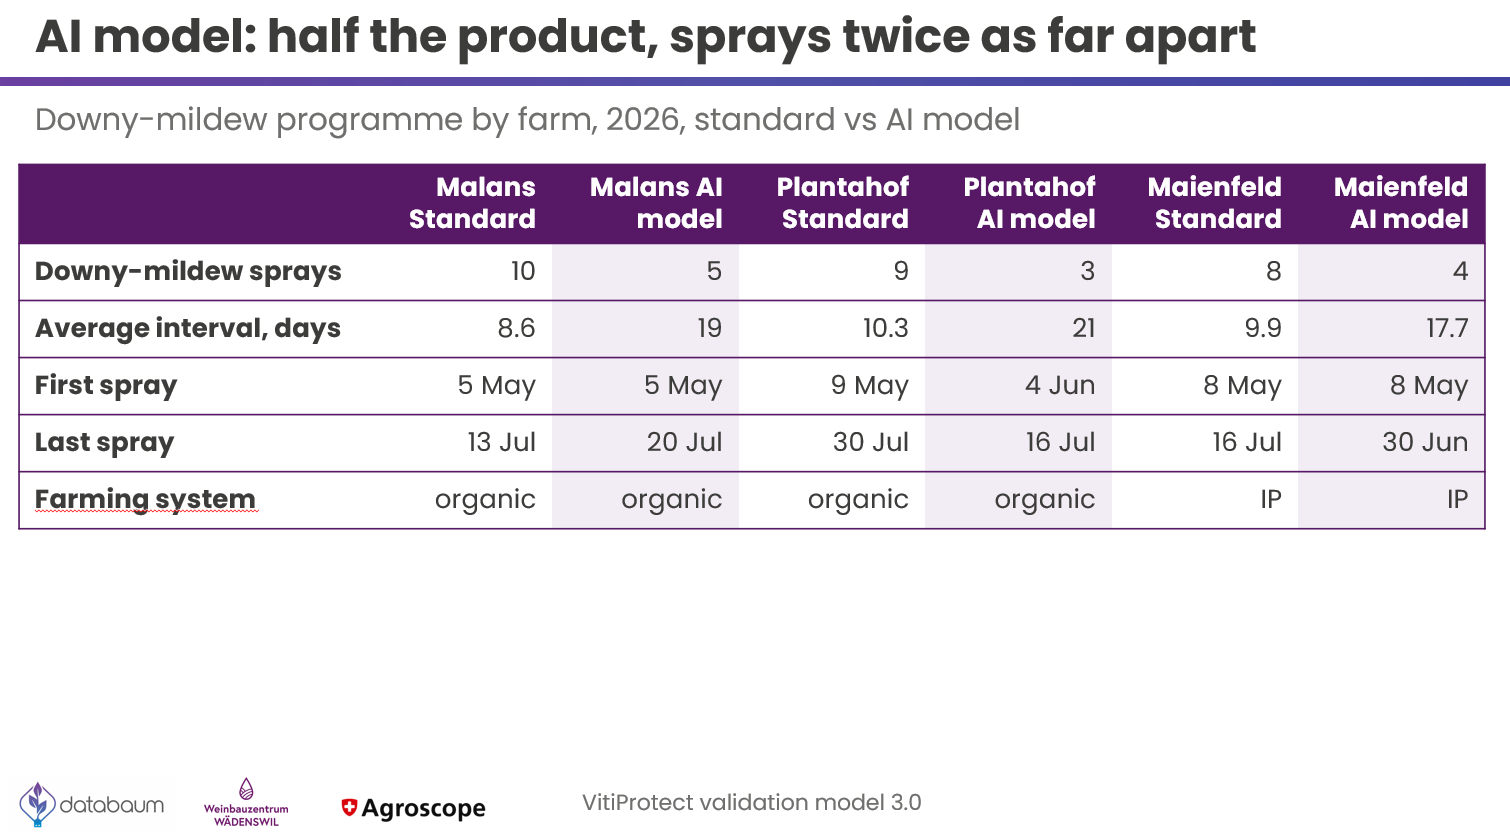
According to the detailed treatment programme, the three standard plots received 10, 9 and 8 sprays, while their corresponding VitiProtect 3.0 plots received only 5, 3 and 4. Treatment intervals increased from approximately 8.6–10.3 days under standard practice to 17.7–21 days with the AI-supported programme.
In other words, the VitiProtect 3.0 programme did not simply shift spray dates. At several points in the season, it supported a decision not to apply another treatment yet.
Across the three farms, the detailed programme therefore represents treatment reductions of approximately 50%, 67% and 50%.
Fewer sprays while infection remained low
Reducing applications only has agronomic value if disease remains adequately controlled.
That was the case in the 2026 Graubünden trials.
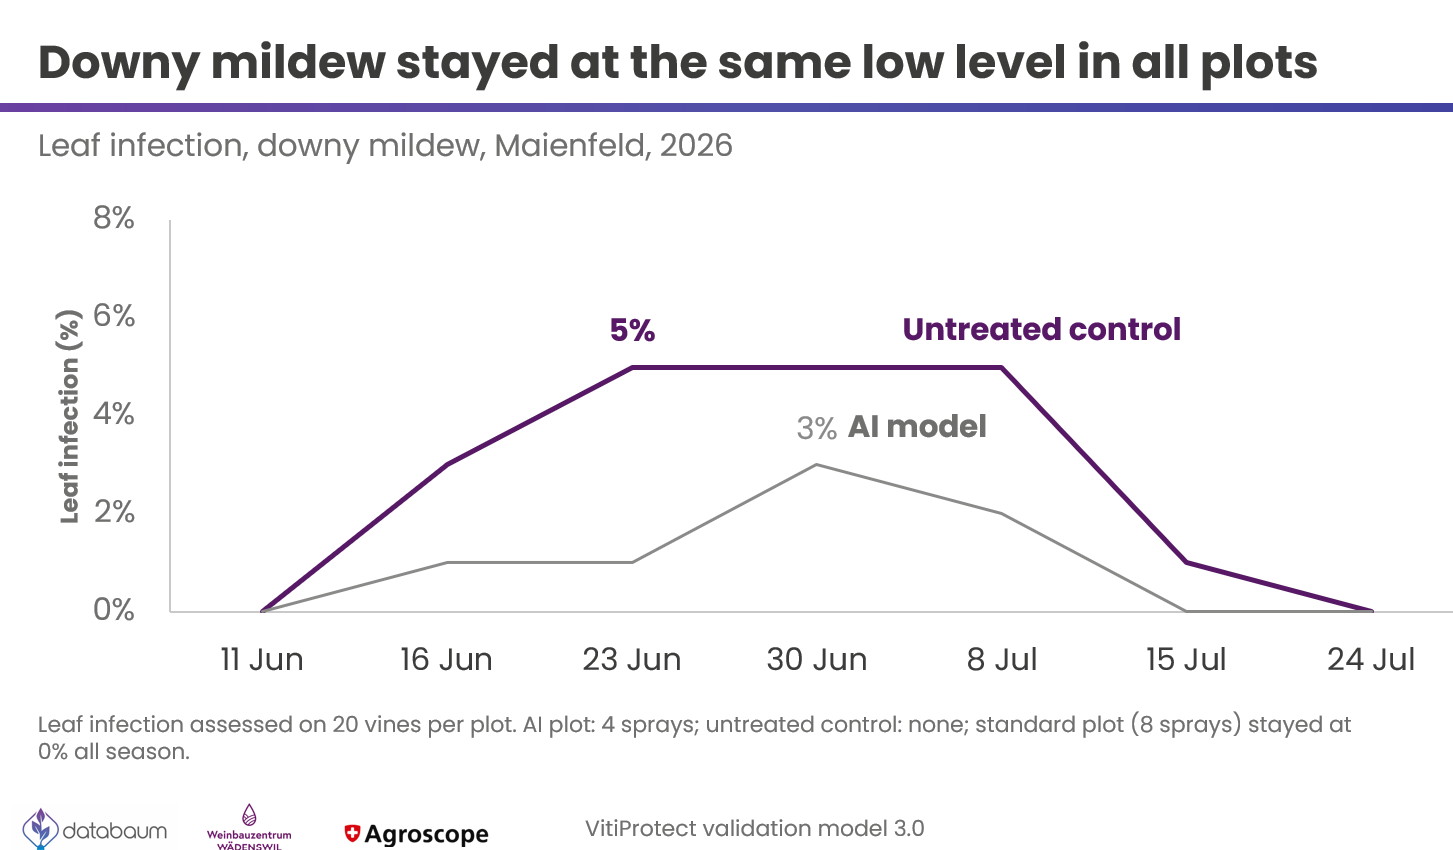
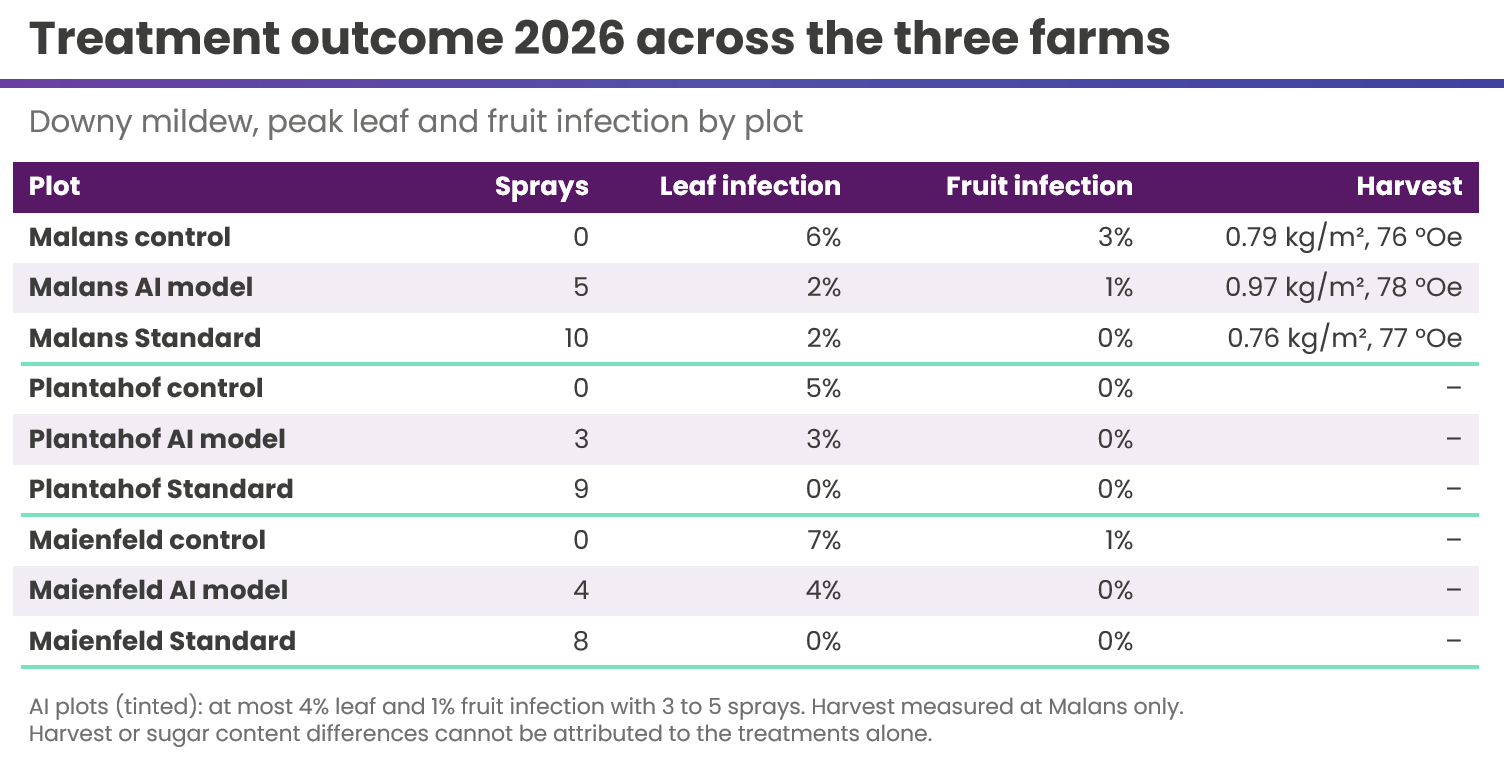
At Malans, the AI managed plot received five treatments and reached a peak of 2% leaf infection and 1% fruit infection. At Plantahof, three treatments resulted in 3% leaf infection and no fruit infection. At Maienfeld, four treatments resulted in 4% leaf infection and no fruit infection.
Across all three AI plots, peak infection therefore remained at or below 4% on leaves and 1% on fruit, with only three to five treatments.
The standard plots generally achieved still lower disease levels, but they did so with considerably more applications.
This distinction is central to the concept behind VitiProtect 3.0. The objective is not necessarily to drive every measurable infection indicator to zero. It is to support growers in balancing disease control with treatment intensity.
VitiProtect 3.0 identified fewer infection events
Another important result came from the comparison of predicted downy-mildew infection events.
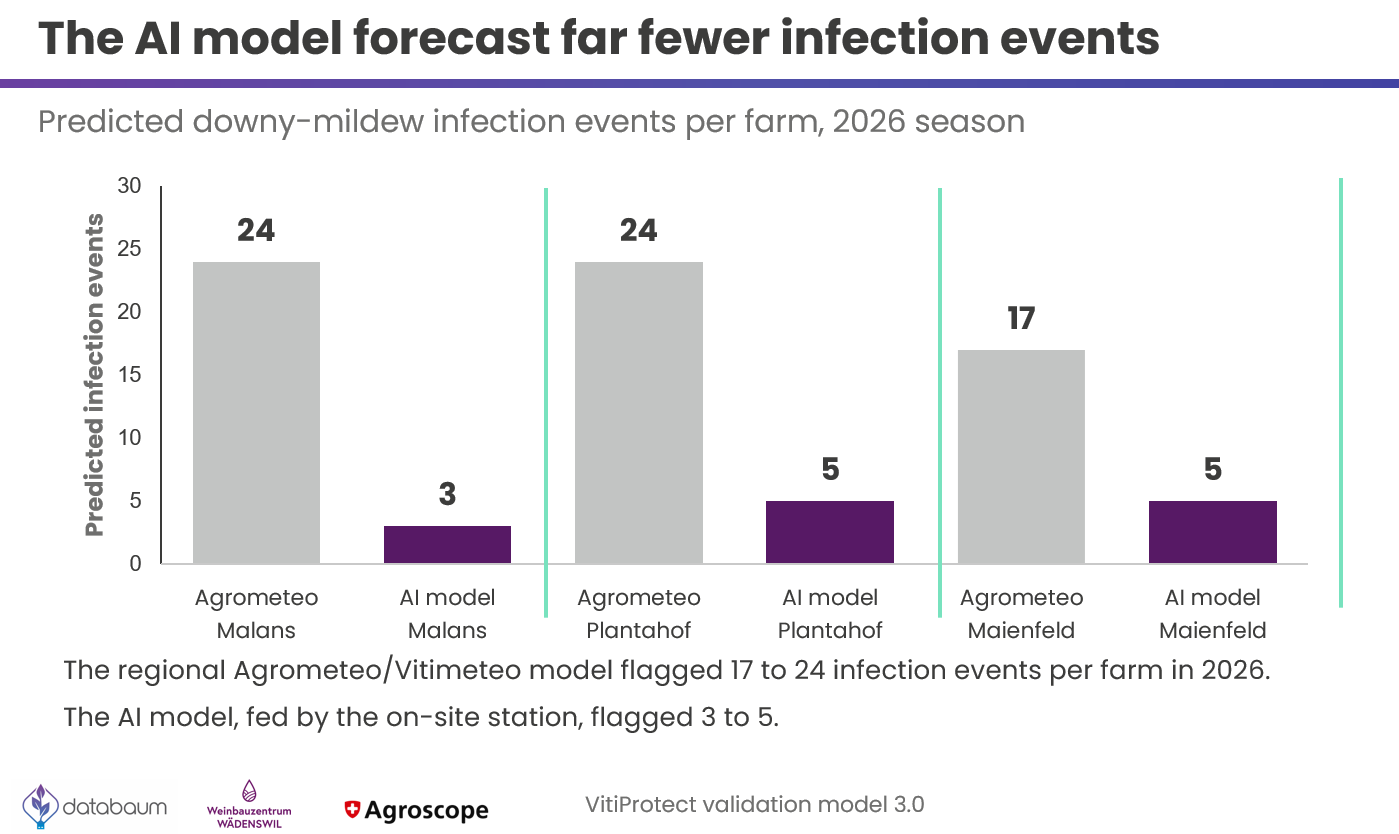
The regional Agrometeo/Vitimeteo model flagged between 17 and 24 infection events per farm during the 2026 season. VitiProtect 3.0, using data from the respective on-site stations, identified 3 to 5 events.
These numbers should not be interpreted as a simple one-to-one accuracy comparison because the models use different approaches and decision logic. Instead, the result demonstrates that VitiProtect 3.0 interpreted the season very differently—and that its more selective risk assessment was accompanied by substantially fewer treatments while measured disease remained low.
That is an important direction for precision viticulture: converting local environmental measurements into actionable risk information rather than simply generating more alerts.
What happened at harvest?
Harvest measurements were available at the Malans site.
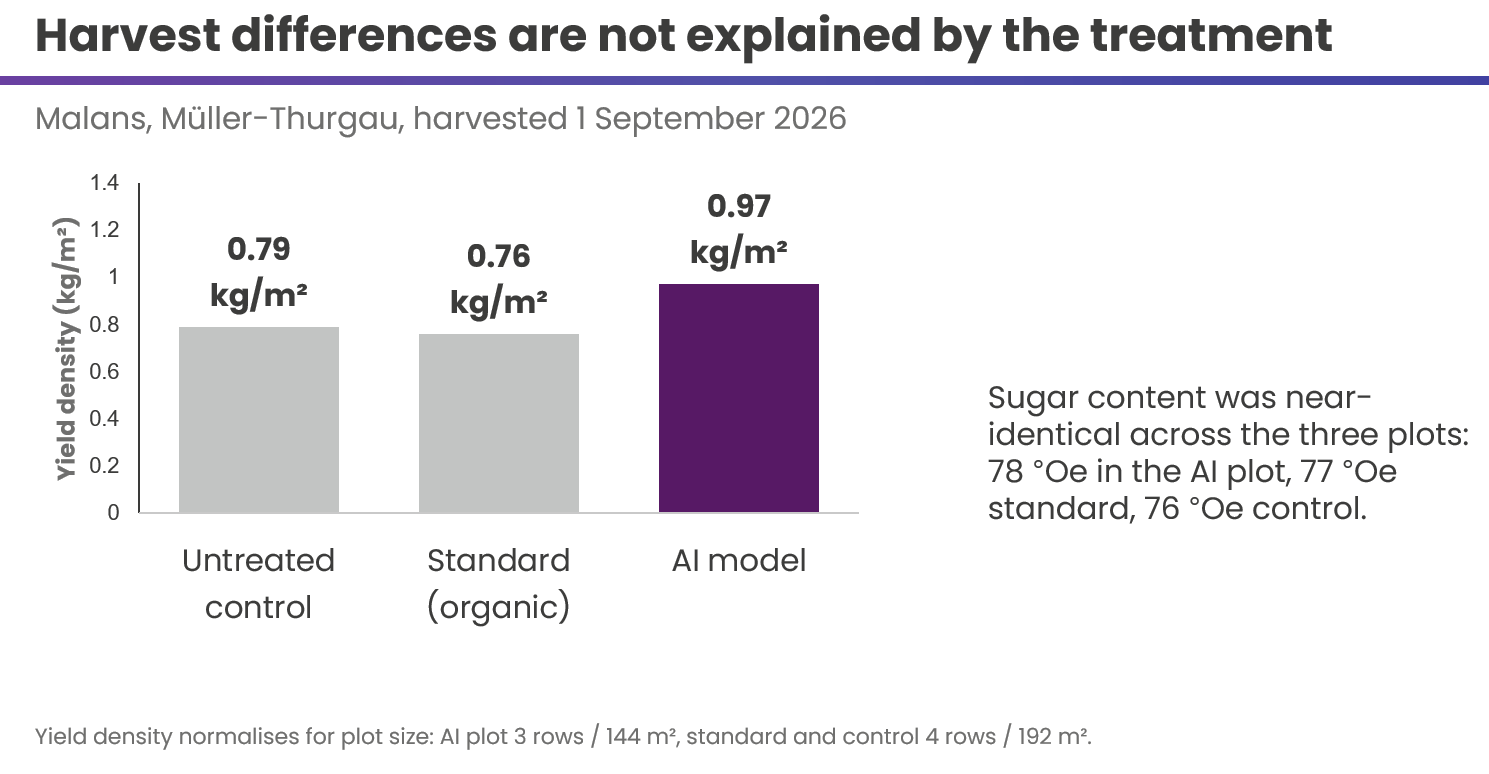
Yield density was 0.97 kg/m² in the VitiProtect 3.0 plot, compared with 0.76 kg/m² under standard organic management and 0.79 kg/m² in the untreated control. Sugar content was very similar across the plots: 78 °Oe in the AI plot, 77 °Oe in the standard plot and 76 °Oe in the untreated control.
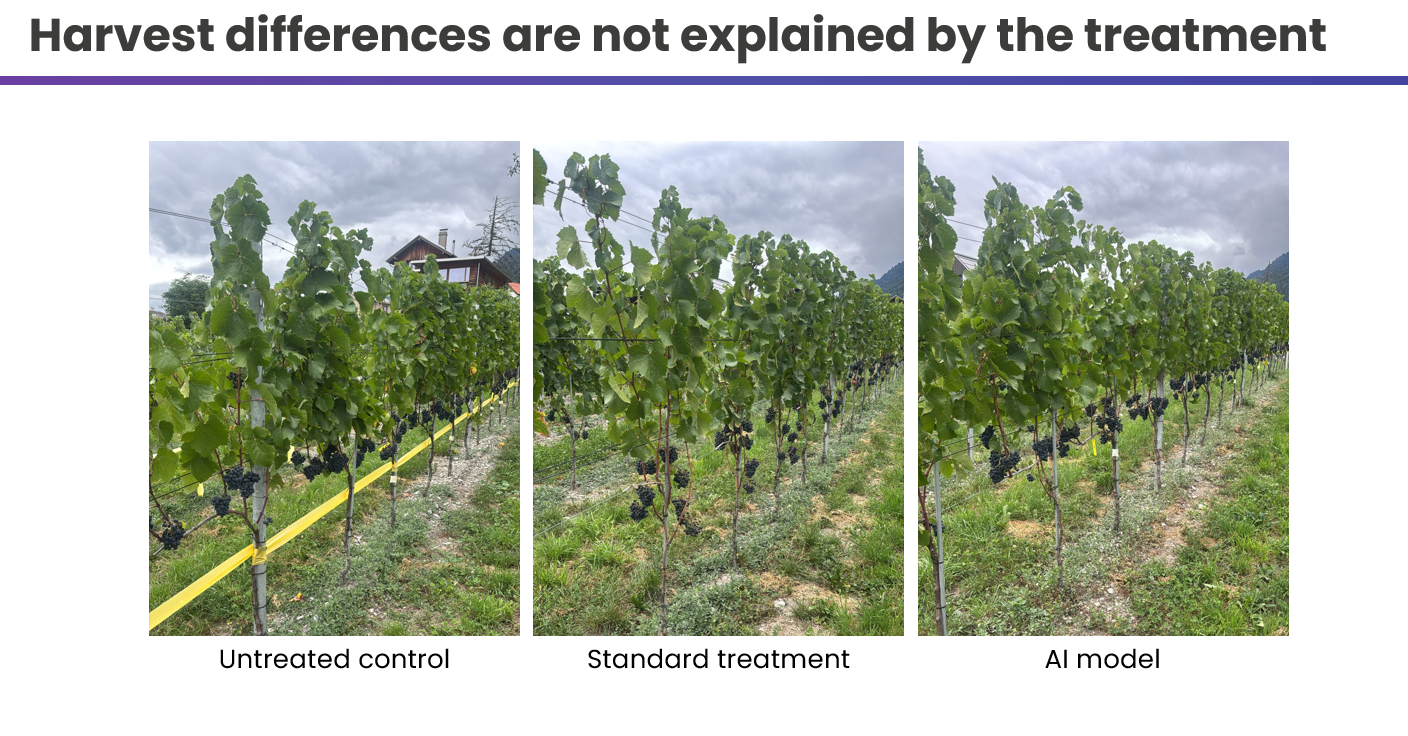
These differences should not be interpreted as evidence that the AI programme increased yield. The report explicitly states that harvest and sugar-content differences cannot be attributed to treatment alone, and harvest measurements were available at only one of the three sites.
The relevant observation is more modest: at the site where harvest was measured, the reduction in treatments was not accompanied by an apparent loss of yield or maturity.
From local measurements to more precise vineyard management
The Graubünden field trials provide a useful picture of what data-driven crop protection can look like in practice.
VitiProtect 3.0 combined hourly field-level weather measurements, disease-risk modelling and regular vineyard assessments. During a season of relatively low downy-mildew pressure, the model-supported programmes used substantially fewer treatments and approximately doubled the interval between applications, while peak disease levels remained low.
These results are promising, but continued multi-year validation remains important. Different seasons bring different combinations of rainfall, temperature, humidity and disease pressure. A robust decision-support system therefore needs to demonstrate its performance not only in relatively low-pressure years such as 2026, but also under more challenging disease conditions.
That is the purpose of VitiProtect's broader validation programme, which in 2026 included sites across ten Swiss cantons.
For growers, the principle is straightforward:
measure conditions locally, assess disease risk more precisely, and apply crop protection when the vineyard needs it—not simply because the calendar says it is time.
That is the direction VitiProtect 3.0 is working toward.