Release 13.05.2022
A quick summary of what we created for you.
Design improvements of Disease View
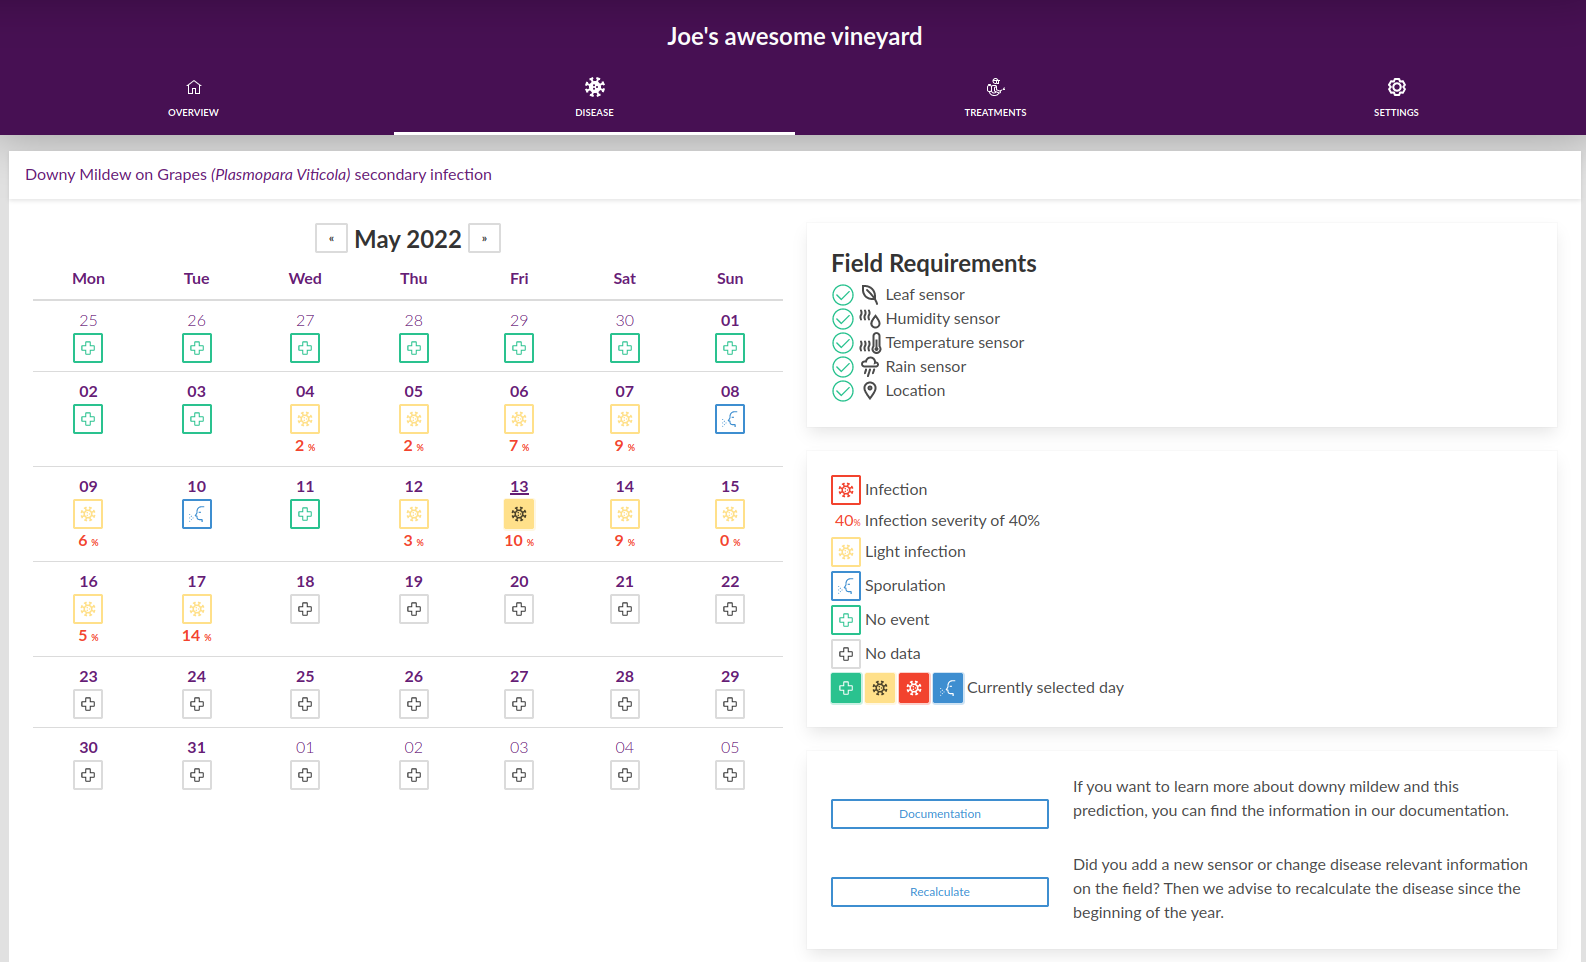
We changed the labels and descriptions to be more concise and clear. The Buttons are also grouped together and take less space.
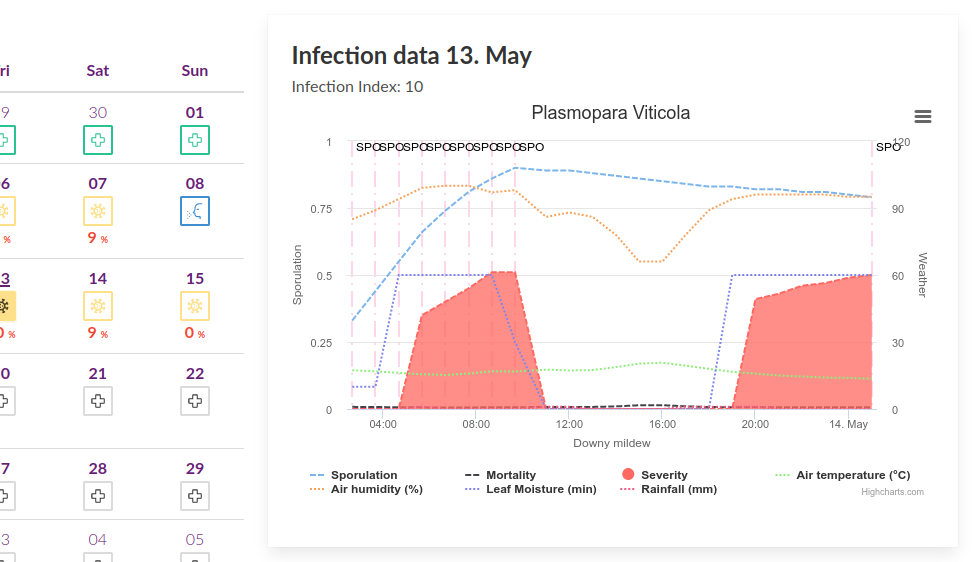
The graph also has improved labels. We received numerous requests to improve this. So we increased the height, decreased load time and improved visibility on mobile. You can now clearly see the infectious periods (red) and due to the left Y-axis staying always between 0 and 1, you can compare the days easier.
We also fixed some translation issues in this view.
Action window improvements
Various small changes lead to a more fluid user experience when choosing the time for protective measures.
Bug fixes
Deleting a field is now possible even though you have sensors, treatments, disease predictions etc. attached to it.
It's no longer possible to have a field without a location. That lead to errors because "planet earth" was just not accurate enough for a precise weather forecast.
We store the weather forecast for each field so that we can analyze the data later.
We reduced the load time significantly.
Next steps
We have been heavily working on our rating app and the primary infection models. So expect those to arrive next week.