Take Control of Your Vineyard Finances: Introducing the databaum Financial Tracker
A free, interactive tool that helps grape farmers track daily costs, log field activities, and see their profit picture in real time.
Why every vineyard needs a financial tracker
Running a vineyard is not just about growing grapes — it is about running a business. Between labor, spray treatments, irrigation, machinery, insurance, and the unpredictability of weather and disease, costs can spiral quickly. Yet many farmers still rely on rough estimates, handwritten notes, or scattered spreadsheets to manage their finances.
The problem? Without a clear picture of where money goes and what it costs to produce each kilogram of grapes, it becomes nearly impossible to answer the questions that matter most:
- Am I making a profit this year?
- What does it actually cost me to produce one kilogram of grapes?
- Where is most of my money going — labor, spraying, machinery?
- What happens to my profit if yield drops by 20%?
- At what grape price do I break even?
These are not abstract accounting questions. They are the difference between a vineyard that thrives and one that slowly loses money without the farmer even realizing it.
That is why we built the databaum Vineyard Financial Tracker — a simple, interactive tool that lives right on your dashboard. No accounting degree required. Just enter your numbers and watch the results update instantly.
What the tracker does
The tracker is organized into three tabs, each serving a distinct purpose in your day-to-day vineyard management.
1. Calendar & activities — your daily field journal
The heart of the tracker is a calendar where you log what happens in your vineyard every day. Click on any date, and you can record:
- Activity type: Choose from 10 common vineyard tasks — spray/treatment, pruning, harvesting, irrigation, fertilizing, soil work, trellising, mowing, machine maintenance, or a custom "other" category.
- Workers engaged: How many people worked on this task.
- Hours worked: The duration of the activity.
- Hourly wage: The cost per hour (including social charges). The default is CHF 28/h, which aligns with AGRIDEA's average for Swiss viticulture.
- Material cost: Any products used — copper sulfate, fungicide, replacement parts, fuel, etc.
- Notes: A free-text field for anything you want to remember. For example: "First downy mildew spray — Cuprofix applied at 2 kg/ha, humid conditions."
The tracker automatically calculates the labor cost (workers × hours × wage) and adds the material cost to give you a total for each activity. You see daily totals, monthly totals, and a running log of everything recorded, sorted by date.
Why this matters: Over the course of a season, these daily entries build up into a precise, granular record of your actual costs — not estimates, not averages from a reference table, but your real numbers. When you switch to the Finances tab, all of these logged costs flow directly into your profit calculation.
Example: logging a spray treatment
Say it is May 10th. You applied a fungicide treatment against downy mildew. Two workers were engaged for 4 hours each, at CHF 28/h. The fungicide itself cost CHF 180 for the application.
You would enter:
- Activity: Spray / treatment
- Workers: 2
- Hours: 4
- Wage: 28 CHF/h
- Material cost: 180 CHF
- Note: "Downy mildew — Cuprofix 2 kg/ha, high humidity"
The tracker calculates: 2 × 4 × 28 = CHF 224 labor + CHF 180 material = CHF 404 total. This entry is saved, timestamped, and will appear in your activity log and financial charts.
2. Finances & charts — your profit picture
This tab takes all the costs logged in the calendar and combines them with your fixed annual costs to show a complete financial overview. You enter:
Revenue inputs:
- Vineyard area (hectares)
- Expected grape yield (kg/ha)
- Grape selling price (CHF/kg)
- Subventions and subsidies (CHF/ha/year)
Fixed annual costs (per hectare):
- Irrigation
- Machinery and fuel
- Fertilizer
- Insurance (hail, frost, general)
- Miscellaneous and admin
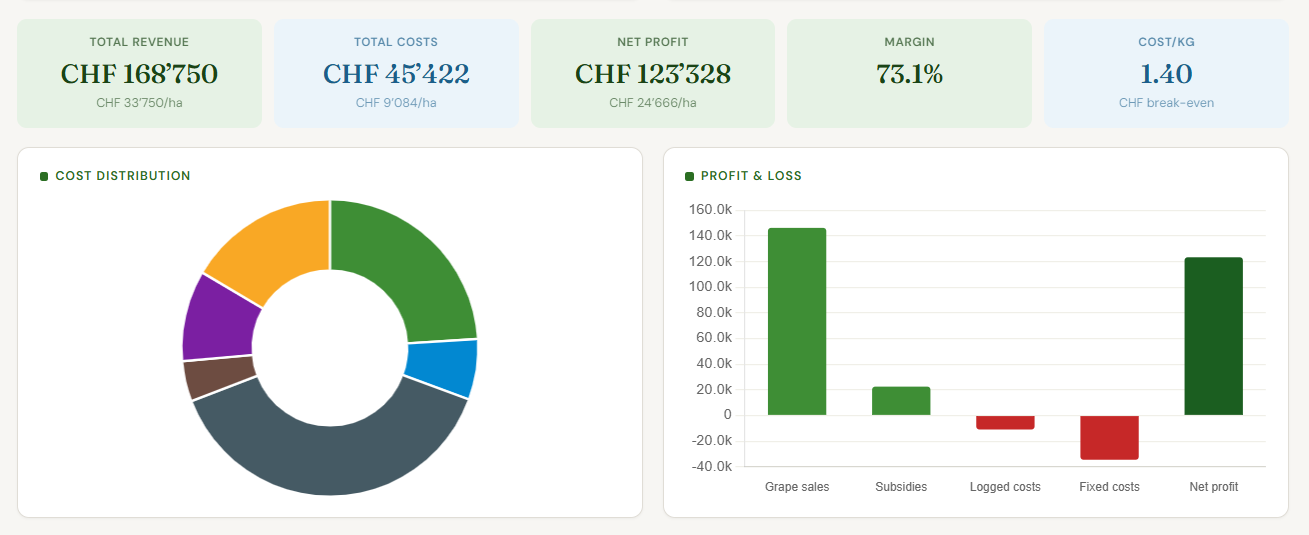
The tracker then produces five key metrics, four charts, and a clear profit/loss answer.
The five key metrics
| Metric | What it tells you |
|---|---|
| Total revenue | Your grape sales plus subsidies, across your entire vineyard. |
| Total costs | Everything — daily logged activities plus fixed annual costs. |
| Net profit | Revenue minus costs. Green if positive, red if negative. |
| Margin | Profit as a percentage of revenue. Tells you how much room you have. |
| Cost per kg | Your total production cost divided by total yield. This is your break-even grape price. |
The cost per kg is perhaps the most important number for any grape farmer. If your cost per kg is CHF 4.20 and you sell grapes at CHF 4.50, your margin is thin. If the market price drops to CHF 4.00, you are operating at a loss. Knowing this number lets you negotiate grape prices from a position of knowledge, not guesswork.
The four charts
Cost distribution (donut chart): Shows at a glance where your money goes. Most Swiss vineyards will see labor dominating — typically 40–60% of total costs for tractor-mechanized operations, and up to 60–70% for hand-worked steep-slope vineyards.
Profit & loss (bar chart): A side-by-side view of your revenue streams (grape sales, subsidies) against your cost categories (logged activities, fixed costs), with your net profit shown as the final bar. Red bars go down, green bars go up — you immediately see which cost items are eating into your profit.
Revenue-to-profit waterfall: This chart starts with your total revenue per hectare and then subtracts each cost category one by one — logged activities, irrigation, machinery, fertilizer, insurance, miscellaneous — until you arrive at your profit (or loss). It is a powerful way to see exactly how revenue "flows" through costs to reach the bottom line. If one bar looks disproportionately large, that is where you should focus optimization efforts.
Profit sensitivity (line chart): What happens to your profit if yield changes? This dual-axis chart plots your profit per hectare and your cost per kg across a range of yield scenarios — from 40% to 160% of your expected yield. A separate break-even line shows you exactly where profit crosses zero. The cost-per-kg line (dashed, right axis) shows how unit economics improve with higher yields — a powerful visual for understanding economies of scale in viticulture.
3. Notes — your vineyard notebook
The third tab is a simple, color-coded notebook for observations, reminders, and plans. Each note has a title, body text, a color tag (green, blue, yellow, red, purple, orange), and a timestamp.
Practical uses:
- "Block A — heavy mildew pressure observed, leaves showing oil spots"
- "Harvest planning: Chasselas ready ~Sept 15, Pinot Noir ~Oct 5"
- "Tractor belt replaced — check again in 200 hours"
- "Meeting with cooperative about 2025 grape price — they offered CHF 4.60 for Chasselas AOC"
Notes are editable and deletable. They stay in the tracker, giving you a chronological record of observations that you can review at season's end or share with your advisor.
Understanding the reference data: AGRIDEA Swiss viticulture benchmarks
The default values in the tracker are not invented numbers. They come from the AGRIDEA 2017 study on production costs in Swiss viticulture — the most comprehensive published reference for vineyard economics in Switzerland.
AGRIDEA surveyed 42 vineyards across all Swiss wine regions and published detailed cost breakdowns for seven different mechanization levels, from fully manual gobelet vines (no mechanization, CHF 52,266/ha total cost) to straddle-tractor operations (CHF 29,709/ha).
Key reference figures from AGRIDEA 2017
| Mechanization level | Total cost/ha | Yield (kg/ha) | Cost per kg | Labor hours/ha |
|---|---|---|---|---|
| No mechanization | CHF 52,266 | 6,302 | CHF 8.29 | 1,092 |
| Light — narrow vines | CHF 38,179 | 6,871 | CHF 5.56 | 822 |
| Light — benches | CHF 37,963 | 8,234 | CHF 4.61 | 778 |
| Tractor — mid-wide | CHF 28,847 | 6,456 | CHF 4.41 | 522 |
| Tractor — leaf mechanization | CHF 28,501 | 6,557 | CHF 4.35 | 430 |
| Tractor — benches | CHF 34,114 | 6,180 | CHF 5.52 | 749 |
| Straddle tractor | CHF 29,709 | 9,650 | CHF 3.04 | 552 |
The tracker defaults to the tractor mid-wide profile (the most common for professional Swiss vineyards), but you should replace these with your own numbers as you log activities through the season.
Labor wage references
AGRIDEA's 2017 wage survey established these hourly rates (including all employer charges):
| Worker type | CHF/hour |
|---|---|
| Farm manager (+ 2% of gross) | CHF 36.35 |
| Qualified labor | CHF 30.00 |
| Unqualified labor | CHF 23.60 |
| Temporary / seasonal | CHF 19.00 |
| Apprentices | CHF 10.00 |
The weighted average across mechanization levels ranges from CHF 22.70/h (tractor-benches) to CHF 28.45/h (non-mechanized), depending on the mix of skilled and unskilled labor.
How to use the tracker: a step-by-step guide
Getting started (5 minutes)
- Go to the Finances tab and enter your basic numbers: vineyard area, expected yield, grape selling price, and subsidies. Set your fixed annual costs (irrigation, machinery, fertilizer, insurance, miscellaneous).
- The KPIs and charts will immediately show your projected profit picture based on these inputs.
Daily use (2 minutes per entry)
- Switch to the Calendar tab each time you or your workers complete a vineyard task. Click the date, hit "+ Add activity," fill in the details, and save. It takes about 30 seconds per entry.
- Over the season, your logged costs will accumulate. The Finances tab automatically includes all calendar-logged costs in the total cost calculation.
Weekly review
- Check the Finances tab weekly to see how your actual costs compare to your budget. Watch the waterfall chart — if any cost bar is growing faster than expected, that is your early warning signal.
- Use the Notes tab to jot down observations: disease pressure, weather events, equipment issues, conversations with your cooperative or wine merchant.
End-of-season analysis
- At harvest time, update your actual yield and grape price. The tracker will show your final profit/loss, actual cost per kg, and actual margin.
- Use the sensitivity chart to plan for next year: "If I can increase yield by 10%, my profit improves by CHF X per hectare."
What makes this different from a spreadsheet
You could, of course, track all of this in Excel. Many farmers do. But the databaum tracker offers several advantages:
It is purpose-built for vineyards. The activity types, cost categories, and reference data are all specific to viticulture. You are not adapting a generic accounting template — you are using a tool designed for grape farming.
It calculates everything instantly. Change one input and every KPI, chart, and projection updates in real time. No formulas to maintain, no cells to drag, no risk of accidentally breaking a calculation.
It combines daily logging with annual financials. Most spreadsheets force you to choose between a detailed activity log and a high-level P&L. This tracker does both — your daily entries feed directly into the financial model.
The charts tell the story. A waterfall chart showing how revenue turns into profit through each cost layer communicates more in 5 seconds than a table of numbers ever could. The sensitivity chart answers "what if" questions that would require building a separate scenario model in Excel.
It lives on your databaum dashboard. If you are already using databaum sensors for disease prediction, weather monitoring, and soil moisture tracking, the financial tracker adds the economic dimension. You can see not just what is happening in your vineyard, but what it costs — and whether your operation is profitable.
Practical tips for accurate tracking
Log activities on the same day they happen. Memory fades quickly. A 30-second entry on the day of the spray is far more accurate than trying to reconstruct three weeks of work at the end of the month.
Include all labor — including your own. Many family-run vineyards undercount costs because the owner's time is "free." It is not. If you spend 4 hours pruning, log it at the appropriate wage rate. This gives you the true cost of production.
Track material costs at the point of use, not purchase. If you buy a drum of copper sulfate for CHF 500 that lasts 5 applications, log CHF 100 per application as material cost, not CHF 500 on the purchase date.
Review monthly totals to catch anomalies. If your May costs are CHF 8,000 but June suddenly jumps to CHF 15,000, investigate. Was there an unusual event (hail damage repair, extra spray applications), or is it a data entry error?
Update yield and price at harvest. The tracker uses your estimated yield and price for projections throughout the season. Once you know the actual numbers, update them for a true P&L.
A note on the data
The AGRIDEA reference figures used in this tracker come from the 2017 study "Frais de production en viticulture — Résultats technico-économiques 2017." This remains the most recent comprehensive cost study for Swiss viticulture. Costs have evolved since 2017 — wages have increased, energy prices have fluctuated, and input costs have changed. The tracker's purpose is not to provide definitive cost benchmarks but to give you a starting framework that you replace with your own real data over time.
For labor budgeting and long-term planning, AGRIDEA recommends using multi-year averages rather than relying on any single year's figures, as annual variations (frost, drought, disease pressure) can significantly affect costs.
Start tracking today
The vineyard financial tracker is available now on your databaum dashboard. Open it, enter your farm parameters, and start logging your first activities. Within a few weeks, you will have a clearer picture of your vineyard's economics than most farmers achieve in a lifetime.
Because at the end of the day, healthy vines and healthy finances go hand in hand.
The databaum Vineyard Financial Tracker is part of the databaum platform for precision viticulture. databaum uses AI-powered sensors and prediction models to help vineyard owners optimize disease management, irrigation, and crop protection. Learn more at databaum.ch.
Questions or feedback about the tracker? Contact us at saurabh@databaum.ch.