How to Use the AI Downy Mildew Model to Plan Vineyard Treatments
Downy mildew management depends on timing. A treatment that is applied too early may lose effectiveness before infection pressure peaks, while a treatment applied too late may not adequately protect the vineyard. To support growers with this decision, databaum’s AI disease prediction model combines field inspection data with weather-driven disease development signals to identify the most relevant treatment windows.
This article explains the practical protocol for using the model in daily vineyard operations.
What the model is designed to do
The AI disease prediction model is built on field inspection data, which means it reflects observed disease pressure in real vineyard conditions. The model is most informative when used as part of a structured decision workflow rather than as a single standalone indicator.
The recommended approach is to move from a broad weekly overview to a more detailed daily and hourly interpretation only when the disease pressure requires closer attention.
Recommended decision protocol
To assess disease pressure and determine whether a treatment is needed, follow this sequence:
1. Start with the AI weekly disease overview
Use the weekly view as the first screening layer.
- If the week is entirely green, spraying can usually be skipped.
- If the weekly forecast shows yellow, orange, or red, move to the daily view for closer inspection.
The weekly model should always be your first reference point because it is based on weekly disease observation data and is therefore more robust than shorter-term formats.
2. Check the AI daily disease pressure
The daily view helps confirm whether disease pressure is persistent or only short-lived.
- If the daily forecast remains green, treatment is generally not needed.
- If yellow or orange appears over consecutive days, treatment planning should begin.
- If the daily signal becomes red, treatment should be considered urgently.
At this stage, it is also useful to compare the AI signal with the primary mechanistic model.
3. Review the primary mechanistic downy mildew model
The mechanistic model provides an additional disease-risk perspective based on weather and biological infection conditions.
- If the mechanistic model also shows yellow, orange, or red, this strengthens the case for treatment.
- This comparison is especially important during the early season, when growers should be particularly cautious about primary infections.
The AI model and the mechanistic model should be interpreted together, not in isolation.
4. Monitor the incubation progress curve
Once treatment is likely needed, the next step is to monitor the AI daily disease incubation progress graph.
The treatment should ideally be scheduled when the incubation progress is approaching 80% completion. This is the most relevant timing indicator for intervention.
Because incubation progress changes dynamically with the weather forecast, this value can update hourly. Growers should therefore continue monitoring the graph until the final treatment timing is confirmed.
5. Use the spraying window for operational timing
After identifying the biological timing, check the available spraying window.
This step helps optimize the application according to:
- rainfall risk,
- humidity,
- drying conditions,
- and the expected performance characteristics of the selected plant protection product (PPP).
In other words, the model helps identify when treatment is biologically needed, while the spraying window helps determine when treatment is operationally feasible.
6. Record the treatment in the treatment tab
Once a treatment has been applied, enter it into the treatment tab.
After the treatment is entered, a shield indicator appears. This indicates that the vineyard is considered protected for the duration of the expected treatment effect.
As long as the shield is active, the next spray can usually be skipped. Once the shield disappears, return to step 1 and restart the decision process.
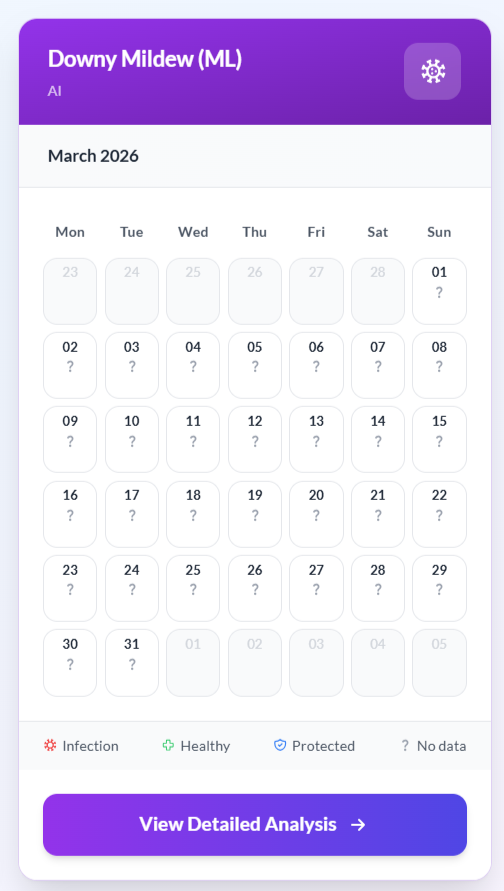
How to interpret the disease pressure colors
The platform uses color coding to simplify the interpretation of disease pressure.
Dark green
The field is healthy and disease pressure is negligible. No treatment is required.
Light green
Minor sporulation may be occurring, but it is still limited. These periods can generally be ignored for spraying decisions.
Yellow
Disease pressure is increasing. This is an alert stage and should trigger closer monitoring, especially in the daily view.
Orange
Disease pressure is significant. If orange persists for consecutive days, treatment planning is recommended.
Red
High disease pressure. Treatment should be strongly considered, ideally by the time incubation reaches around 80%.
Why weekly should come before daily and hourly
A common mistake is to jump directly into the most detailed time format. However, the most detailed view is not always the most reliable.
The AI model is trained on weekly disease observation data, which means:
- weekly predictions are the most stable and informative,
- daily predictions are useful for refining a decision,
- hourly changes are valuable mainly for final timing adjustments.
For this reason, databaum recommends starting with the weekly overview and then zooming into daily and hourly views only when disease pressure is elevated.
Forecast horizon: why only four days?
The platform shows past disease pressure and a 4-day disease forecast.
Forecasts beyond four days are currently not emphasized because weather predictions become increasingly uncertain after that point. Since disease development is highly weather-sensitive, extending the forecast horizon too far would reduce decision quality.
This limitation is intentional and reflects a quality-first approach to operational forecasting.
Practical limitations and ground rules
While the model is a powerful decision-support tool, it should still be used with agronomic judgment.
Organic PPPs
For organic plant protection products, the mode of action and protection duration are often less precisely defined. As a result, treatments may need to be applied more frequently, and the shield logic may be less accurate than for conventional products. This will improve as more field data becomes available.
Piwi varieties
For Piwi varieties, growers should continue following recommendations from cantonal services and Agroscope, especially regarding standard preventive sprays before and during flowering.
Local conditions still matter
The model provides data-backed guidance, but vineyard conditions can vary substantially across plots, slopes, canopy structures, and management systems. Growers should always combine model output with field knowledge and local expert advice.
Product optimization is still evolving
In AI Prototype III, treatment entry is supported, but PPP selection and dosage optimization are not yet automated. These functions are planned for future versions.
Final recommendation
The AI disease model should be used as a decision-support system, not as a fully automatic spray instruction. The most effective workflow is:
- Check the weekly AI overview
- Move to the daily AI view when risk increases
- Confirm conditions in the mechanistic model
- Track incubation progress
- Choose the best spraying window
- Record the treatment and monitor the shield
This workflow helps growers avoid unnecessary sprays when disease pressure is low, while still enabling timely interventions when infection risk becomes critical.
At databaum, our goal is to make disease management more precise, transparent, and practical for real vineyard operations.