Cumulative Growing Degree Days (GDD)
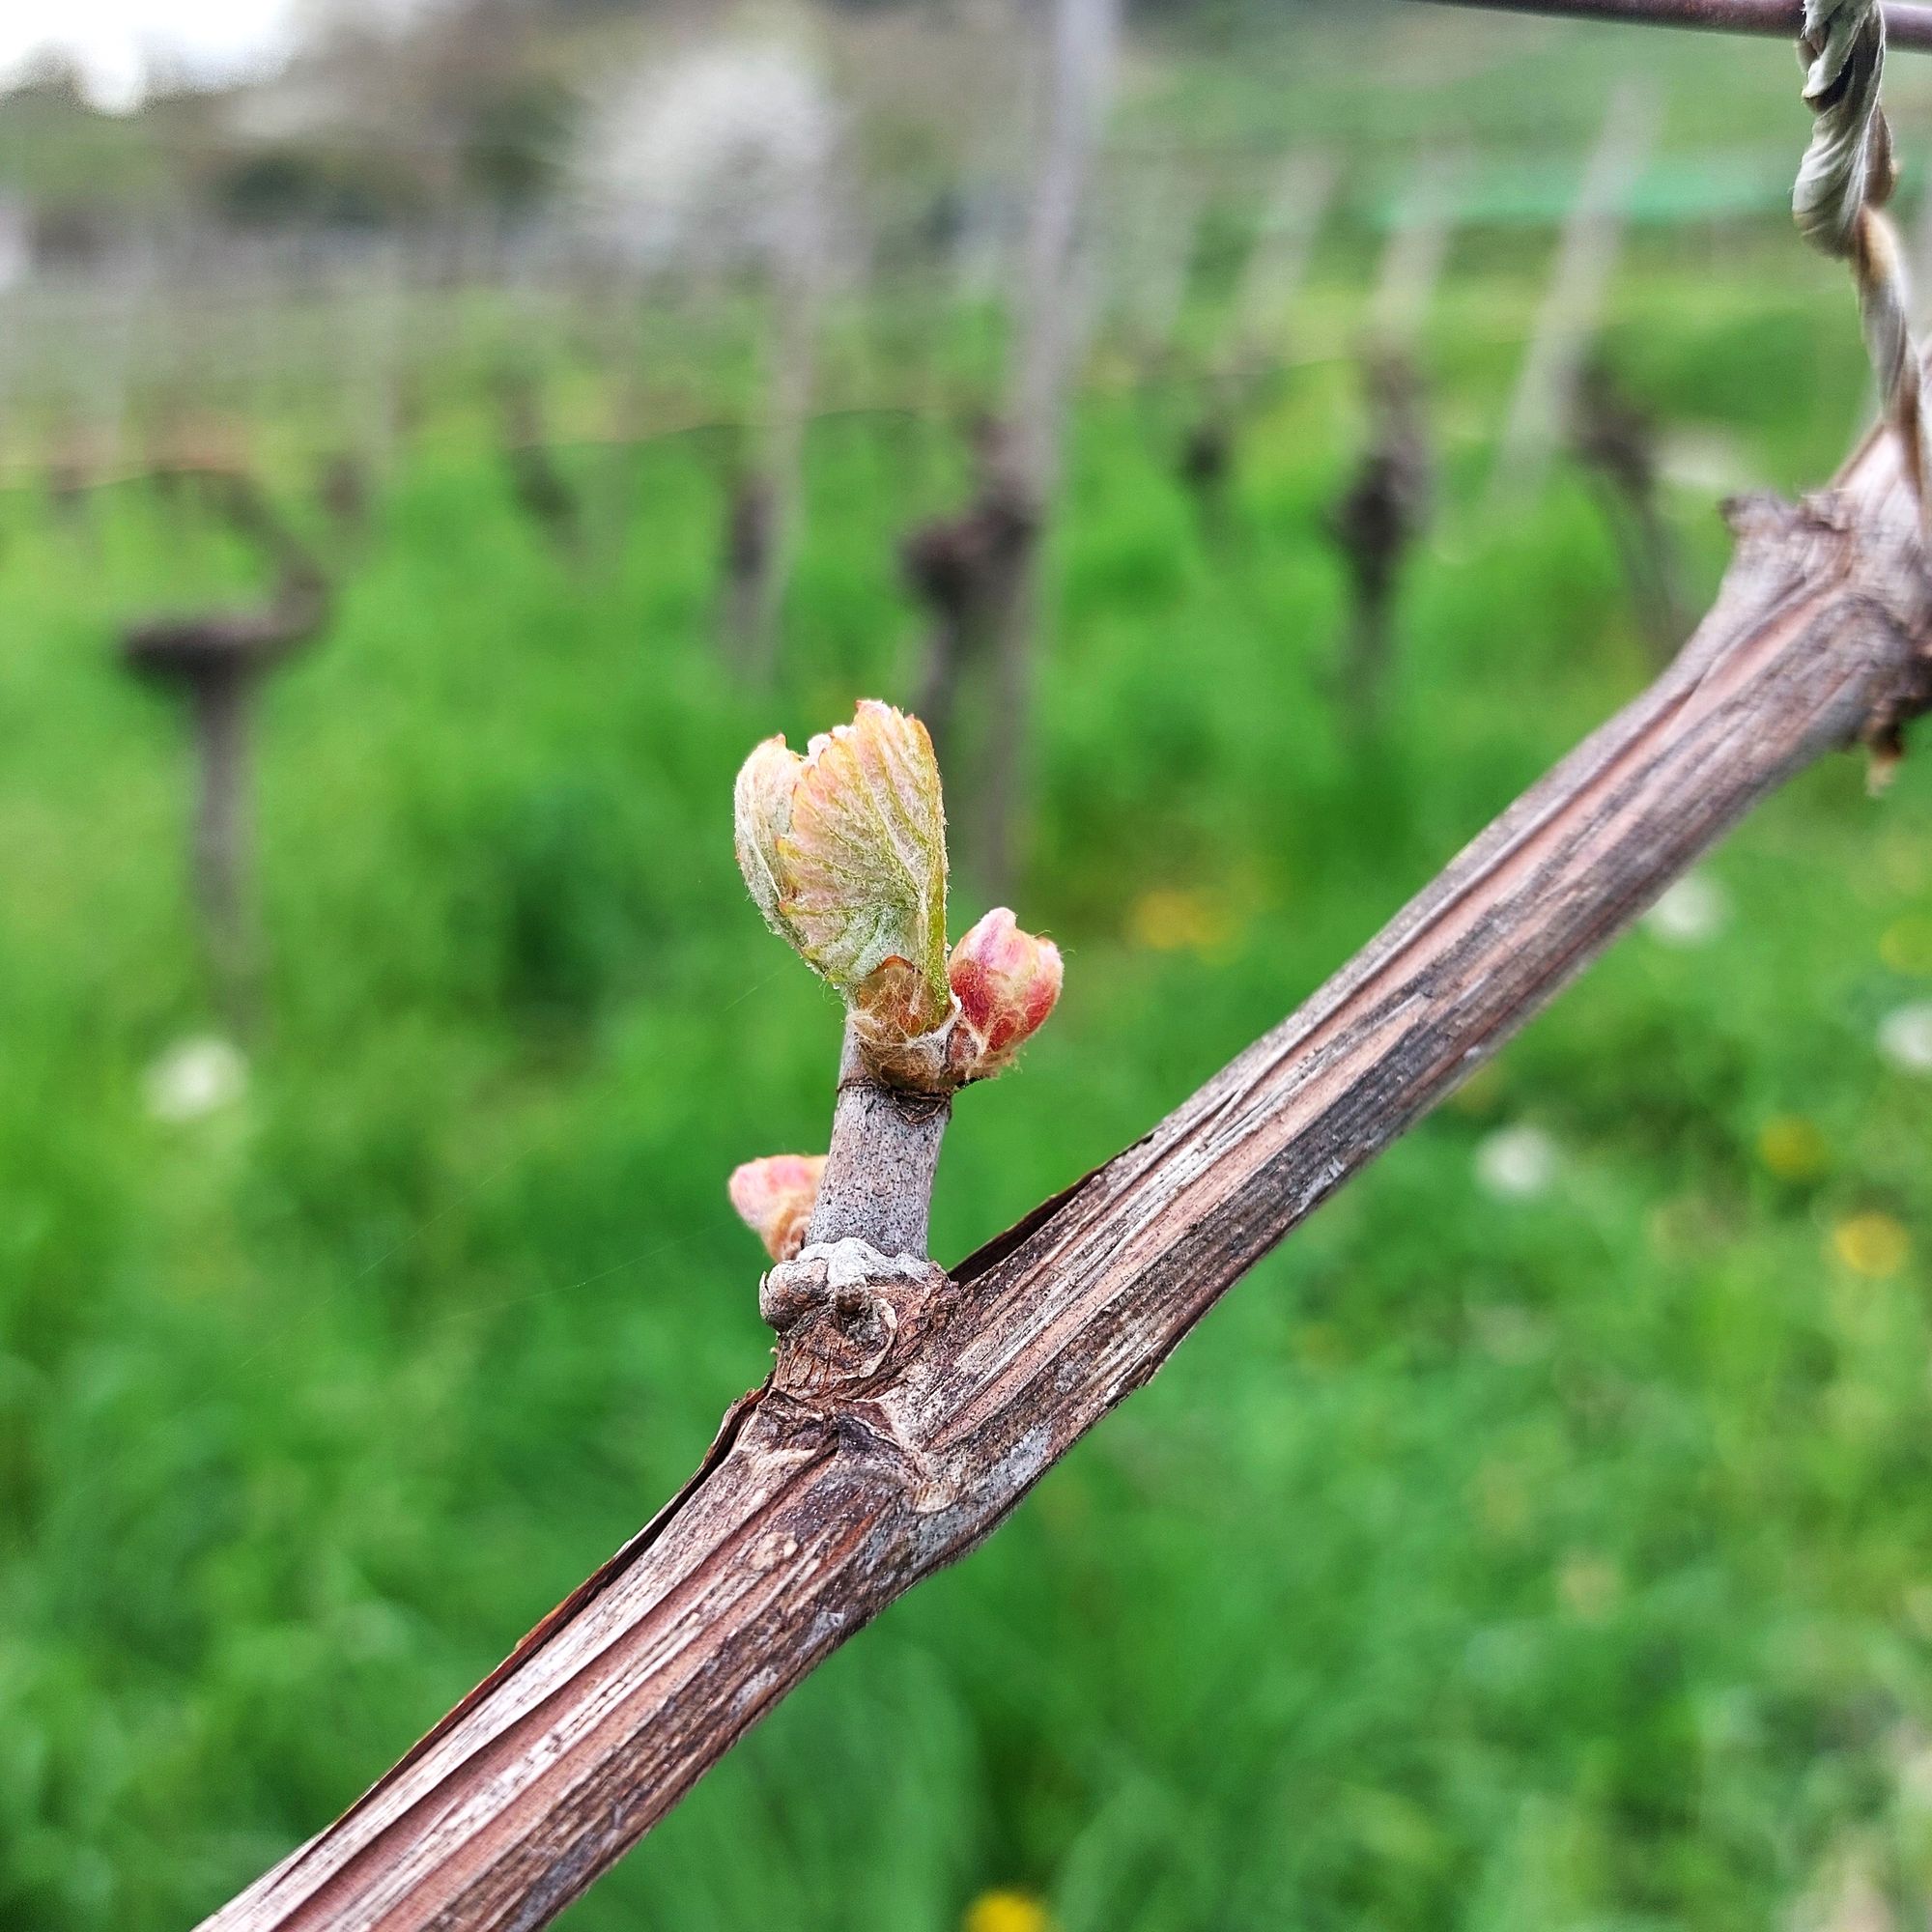
After the cold winters, first observation that we notice in the dormant vineyards is small buds coming out from the branches. Plants use temperature as an external cue to decide when to wake up and stretch those buds.
In previous blog we introduced the correlation between field conditions and plant growth (https://news.databaum.ch/ghost/#/editor/post/65e7860513ea81996033b323). Welcome to our next blog in this series. In the present blog, we go a step deeper to understand cumulative Growing degree days and how farmers can plan their farm activities by gaining information from cumulative degree days. GDD helps vineyard managers make informed decisions about grape cultivation based on temperature patterns.
Understanding Cumulative GDD
What Is GDD?
- GDD represents the accumulated heat over time, specifically the sum of daily temperatures above a certain base temperature.
- In the context of viticulture (grape cultivation), GDD helps us track heat accumulation during the growing season.
- It provides a seasonal overview of heat accumulation, which plays a crucial role in grapevine development.
Why Does It Matter?
- Comparing different grape-growing regions? GDD is your go-to metric.
- Predicting critical vine development stages (like bloom and veraison)? Yep, GDD does that.
- Comparing seasons? GDD reveals variations in grape growth conditions.
Setting the Base Temperature
- Scientists have conducted various experimental studies to determine the ideal base temperature for calculating GDD (Molitor et al., 2014).
- Different geographical locations may require different base temperatures.
- Based on our present data and scientific research, we recommend using either 10°C or 8°C as the base temperature.
- As we gather more data, we’ll fine-tune this recommendation for local conditions.
2024 first quarter is warmer than previous years in Switzerland.
Anyone living in Switzerland can acknowledge that they felt February and March is warmer than previous years, the same observation is conveyed by the meteorological data. Now we dive into a specific case study:
GDD Trends: 2022, 2023, and 2024: We plotted GDD for three years (2022, 2023, and 2024) with base temperatures of 8°C and 10°C.
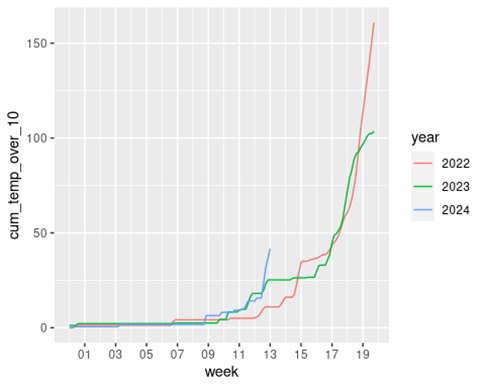
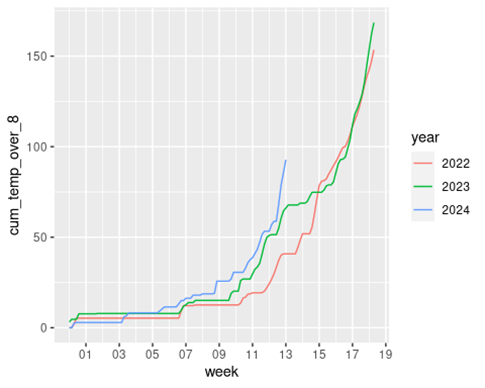
We plotted the GDD for 3 years with 2 base temperatures, 8°C and 10°C. At the time of writing this blog, we had weather station data till week number 13 (March end, 2024).
It’s important to notice that the GDD for 2024 is much higher than previous years. This temperature variation directly impacts grapevine growth and development.
Importance of Field Weather Stations
- Accurate field temperature measurements are crucial for calculating GDD.
- Inaccuracy in field temperature readings can lead to erroneous cumulative degree day calculations.
Virtual Stations or weather data vs. Field Weather Stations:
- While virtual stations and weather data can provide estimates of GDD, they lack the precision of field weather stations.
- Field weather stations directly measure on-site temperature, ensuring accurate GDD calculations.
- We strongly recommend using field weather stations for precise GDD data.
Interrelation with other field parameters: Plant growth is dependent on other factors as well, for example water content, soil nutrients etc. In context of Switzerland, usually all the farms that we are catering are having rich organic and nutrient content and sufficient amount of water available, and farmers don’t face drought conditions. We are monitoring other parameters and when needed we bring them to bring more holistic insights that covers multiple factors.
Climate-Resilient Farming
Farming activities shall be tuned accordingly to put the right fertilizers and plant protection products as the plant growth stage. To learn more about grapevine growth stage, we recommend reading our blog: Grapevine Growth stages (BBCH scale) (https://news.databaum.ch/bbch-scale-for-grapes/).
Adapting to Change:
- Farm activities must align with climatic shifts.
- Precise understanding of farm changes is crucial.
- GDD helps time critical actions like the first sprays in the field.
Precise understanding of the changes happening in the farm is the first step to take the informed decisions. GDD is very helpful to set the timing of first sprays in the field. And if you’re up for some scientific reading, dive into the paper: “Grapevine phenology of cv. Touriga Franca and Touriga Nacional in the Douro wine region: Modelling and climate change projections” (Costa et al., 2019).
Remember, GDD isn’t just a number—it’s a compass guiding vineyards toward fruitful seasons!
References:
Costa, R., Fraga, H., Fonseca, A., De Cortázar-Atauri, I. G., Val, M. C., Carlos, C., Reis, S., & Santos, J. A. (2019). Grapevine phenology of cv. Touriga Franca and Touriga Nacional in the Douro wine region: Modelling and climate change projections. Agronomy, 9(4). https://doi.org/10.3390/agronomy9040210
Molitor, D., Junk, J., Evers, D., Hoffmann, L., & Beyer, M. (2014). A high-resolution cumulative degree day-based model to simulate phenological development of grapevine. American Journal of Enology and Viticulture, 65(1), 72–80. https://doi.org/10.5344/ajev.2013.13066